Bitcoin Minute: Pitchfork Analysis
Exploring the technical insights of Andrews' Pitchfork, past cycle patterns, and potential future trends influenced by Bitcoin news.

Andrews' Pitchfork is a technical indicator that uses three parallel trend lines to identify possible levels of support and resistance as well as potential breakout and breakdown levels. It is created by placing three points at the end of previous trends and then drawing a line from the first point that runs through the midpoint of the other two points.
In general, traders will purchase the asset when the price falls near the support of either the center trendline or the lowest trendline. Conversely, they'll sell the asset when it approaches the resistance of either the centerline or the highest trendline. Even though the centerline can be used to identify areas where a security may find support or resistance, it is generally not as strong as the two outside lines. In practice, the levels identified by this indicator are very useful for identifying strategic positions for stop-loss orders. - Investopedia
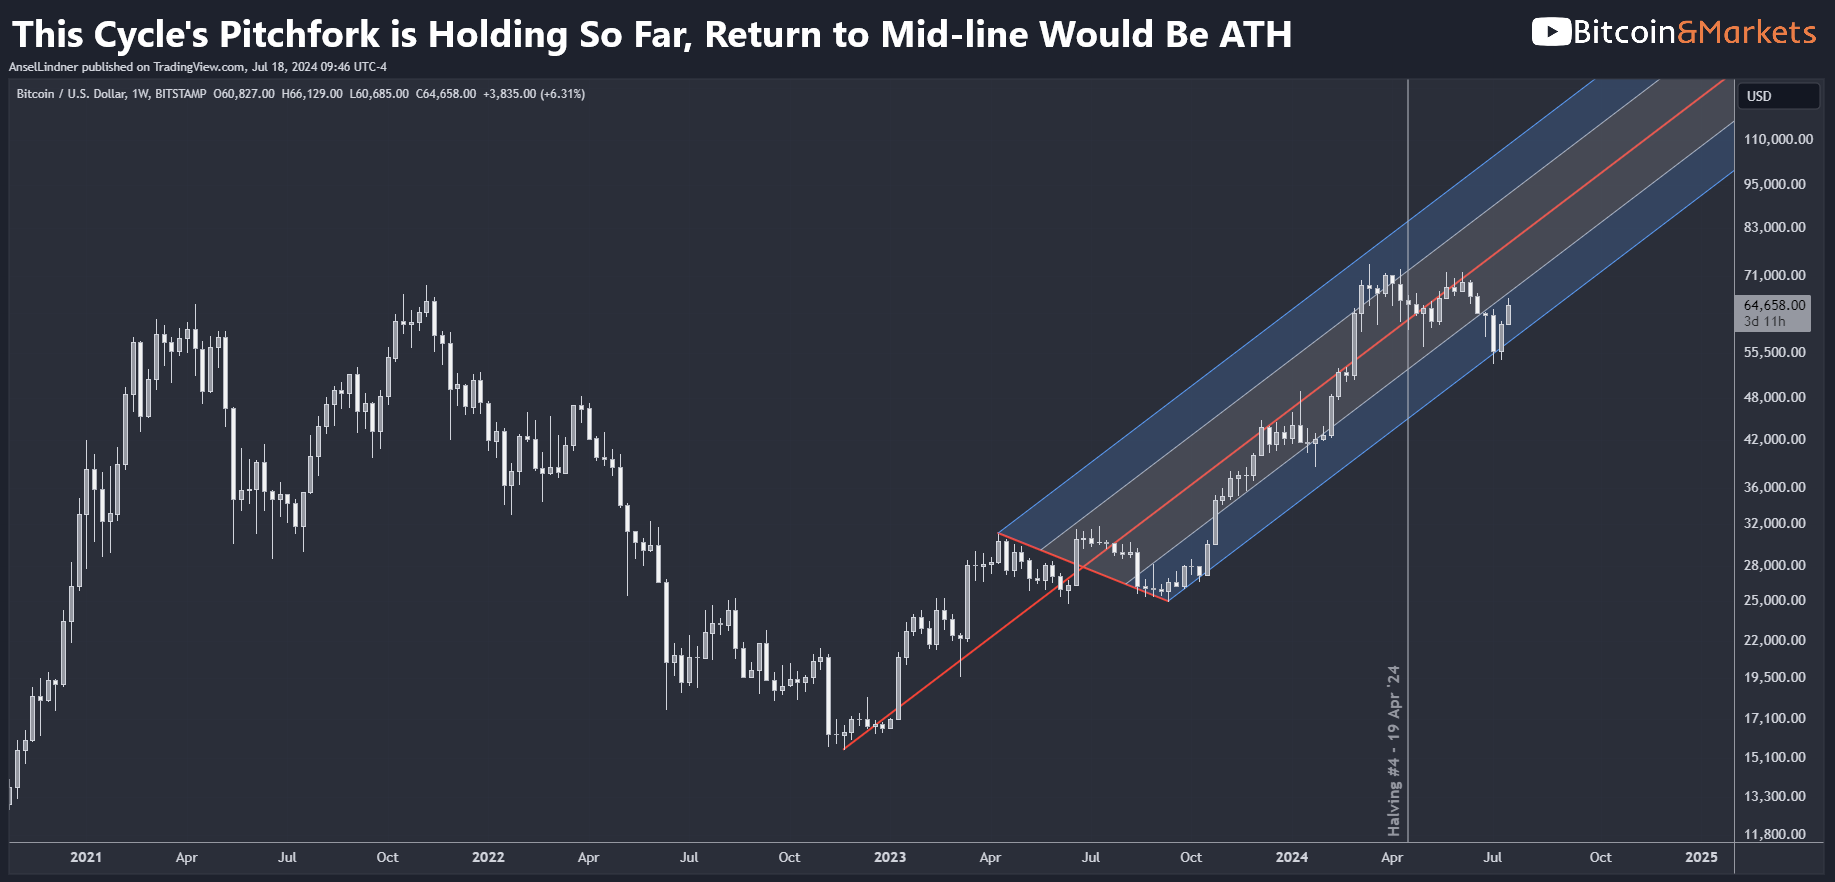
The pitchfork for the current cycle is very interesting. The center line matches support prior to forming the second two points, on the staff of the pitchfork. The center line also is on the exact point where the ETFs launched in January before the little consolidation on the inner bottom channel. Price then rallied to the top of the pitchfork, and pulled back to the center line almost at the exact time of the halving. Most recently, price found support on the outer bottom of the channel.
A return to the center line will put us at a new ATH and grab all the liquidity from the liquidation heat map in that area.
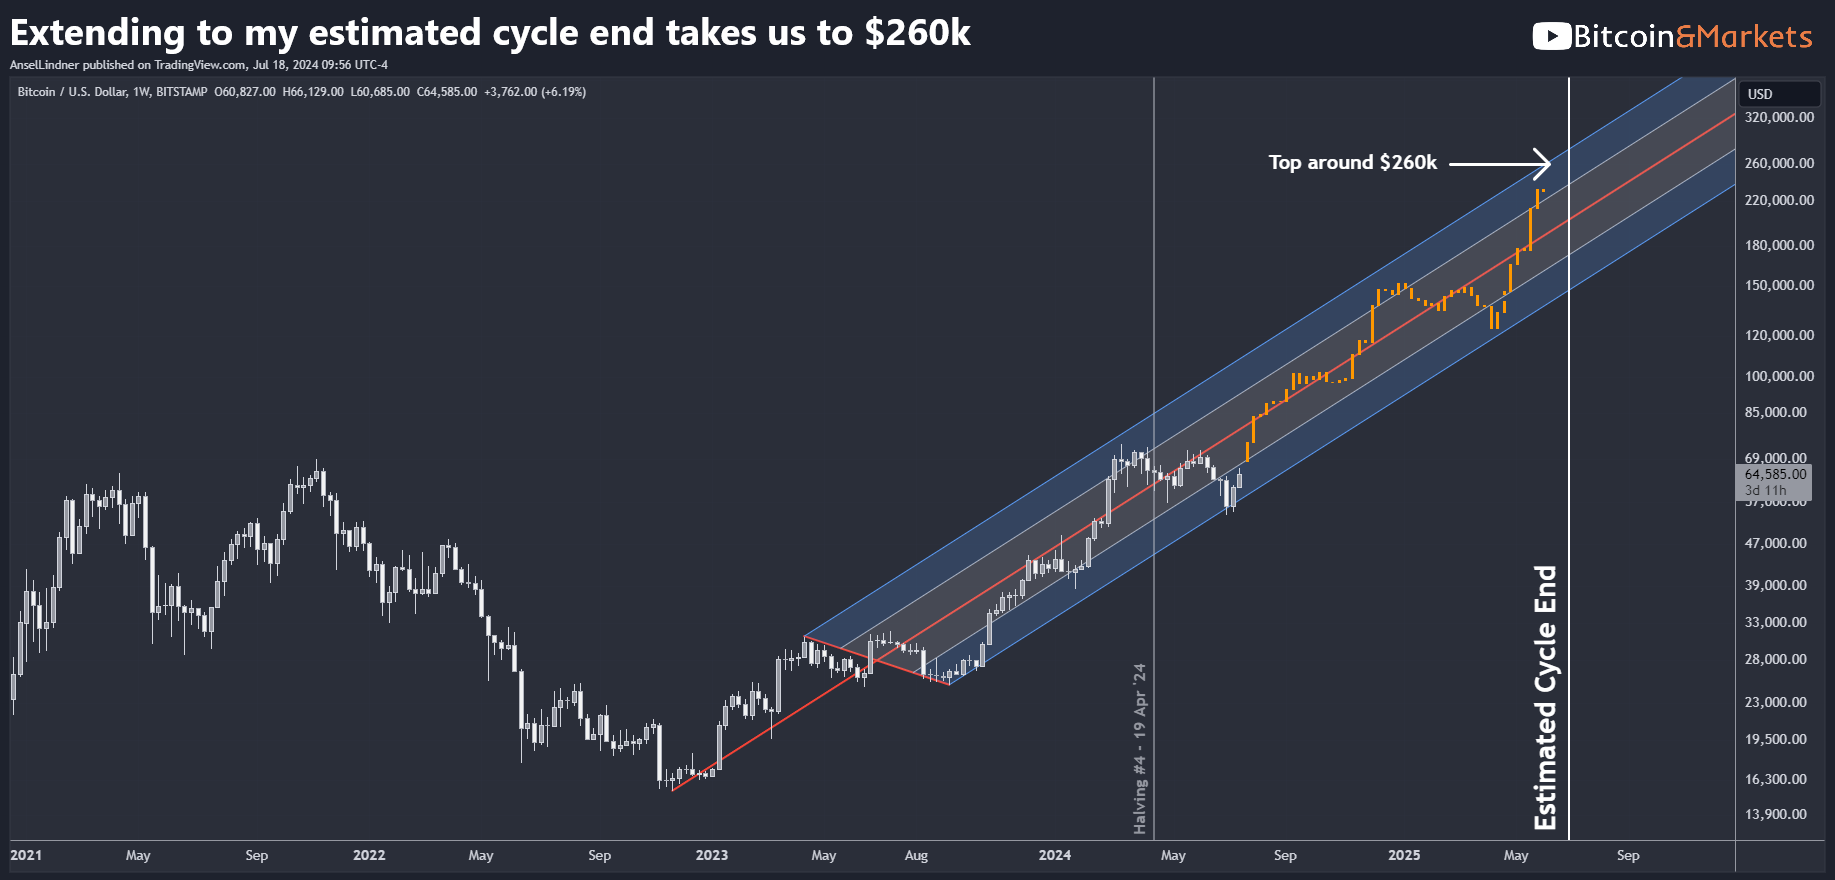
Here I have extended the pitchfork and added the orange ghost candles, they are just copied from the earlier period in the pitchfork. As you can see, I also added my estimated end of the cycle. This is based on previous analysis of cycle patterns. The top of the pitchfork at that time is $260k or slightly higher.
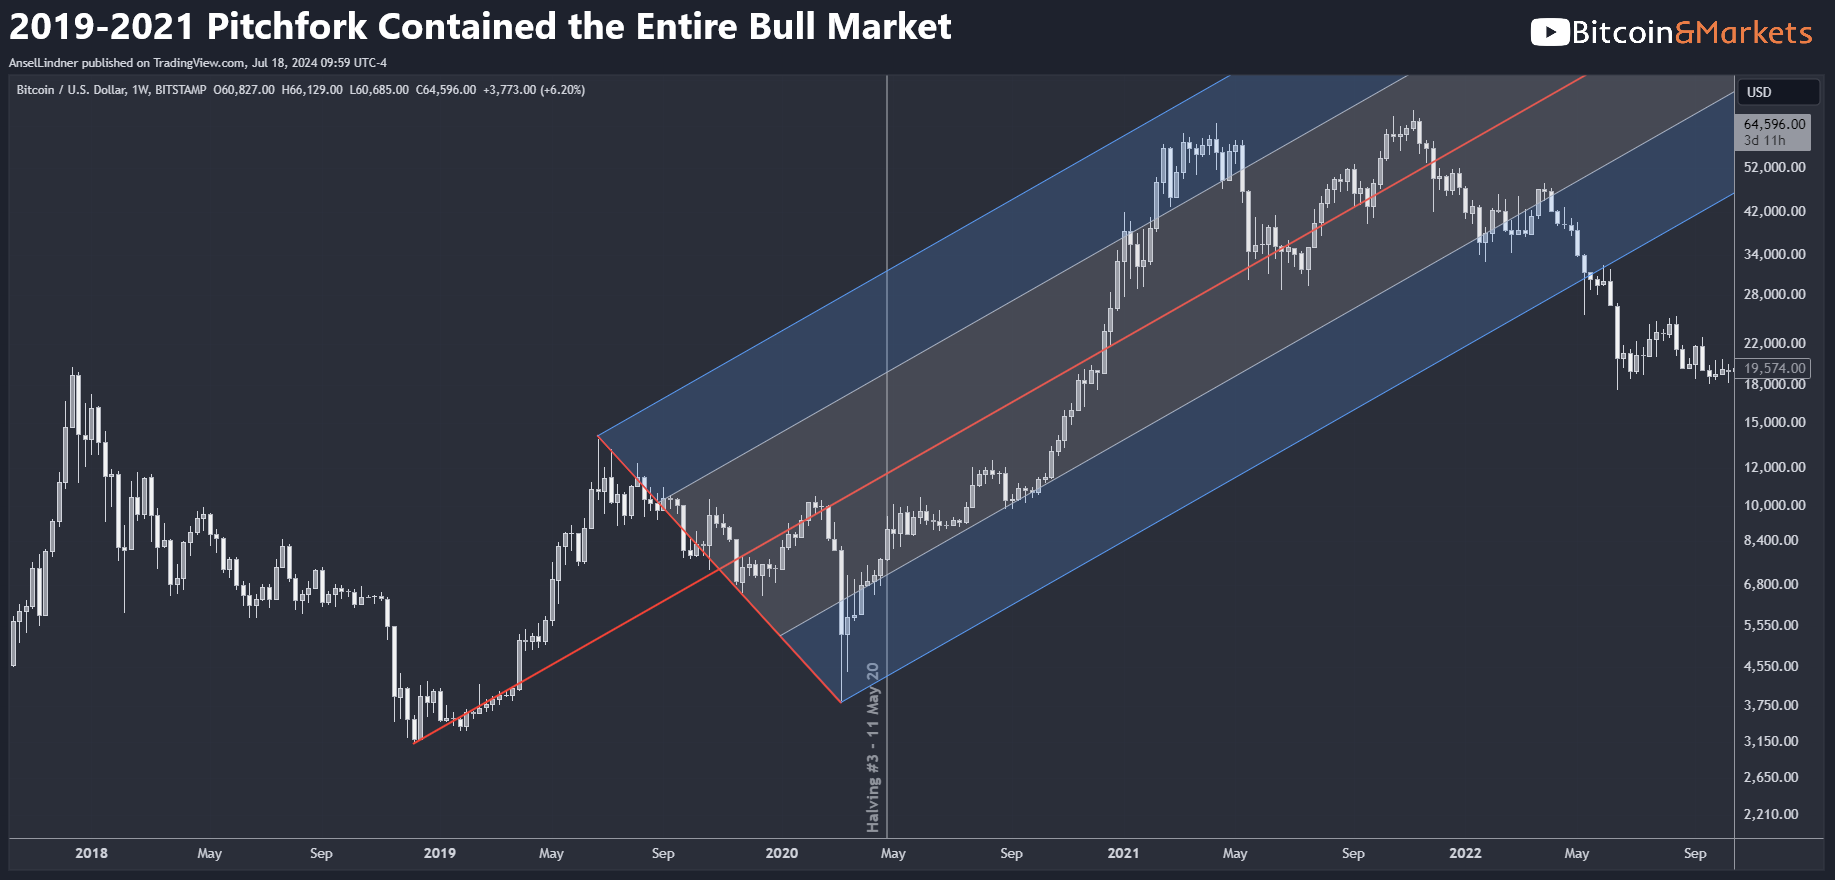
Pitchforks have been a part of bitcoin price analysis for a long time. Below is the 2019-2021 pitchfork. It happened to contain the whole bull market. It is also different that most pitchforks because of the COVID crash low forming the third point. The top of the cycle IMO was that period in the upper outer band, price returned to the center line after that, and even thought the second top was slightly higher, it didn't fit the pattern.
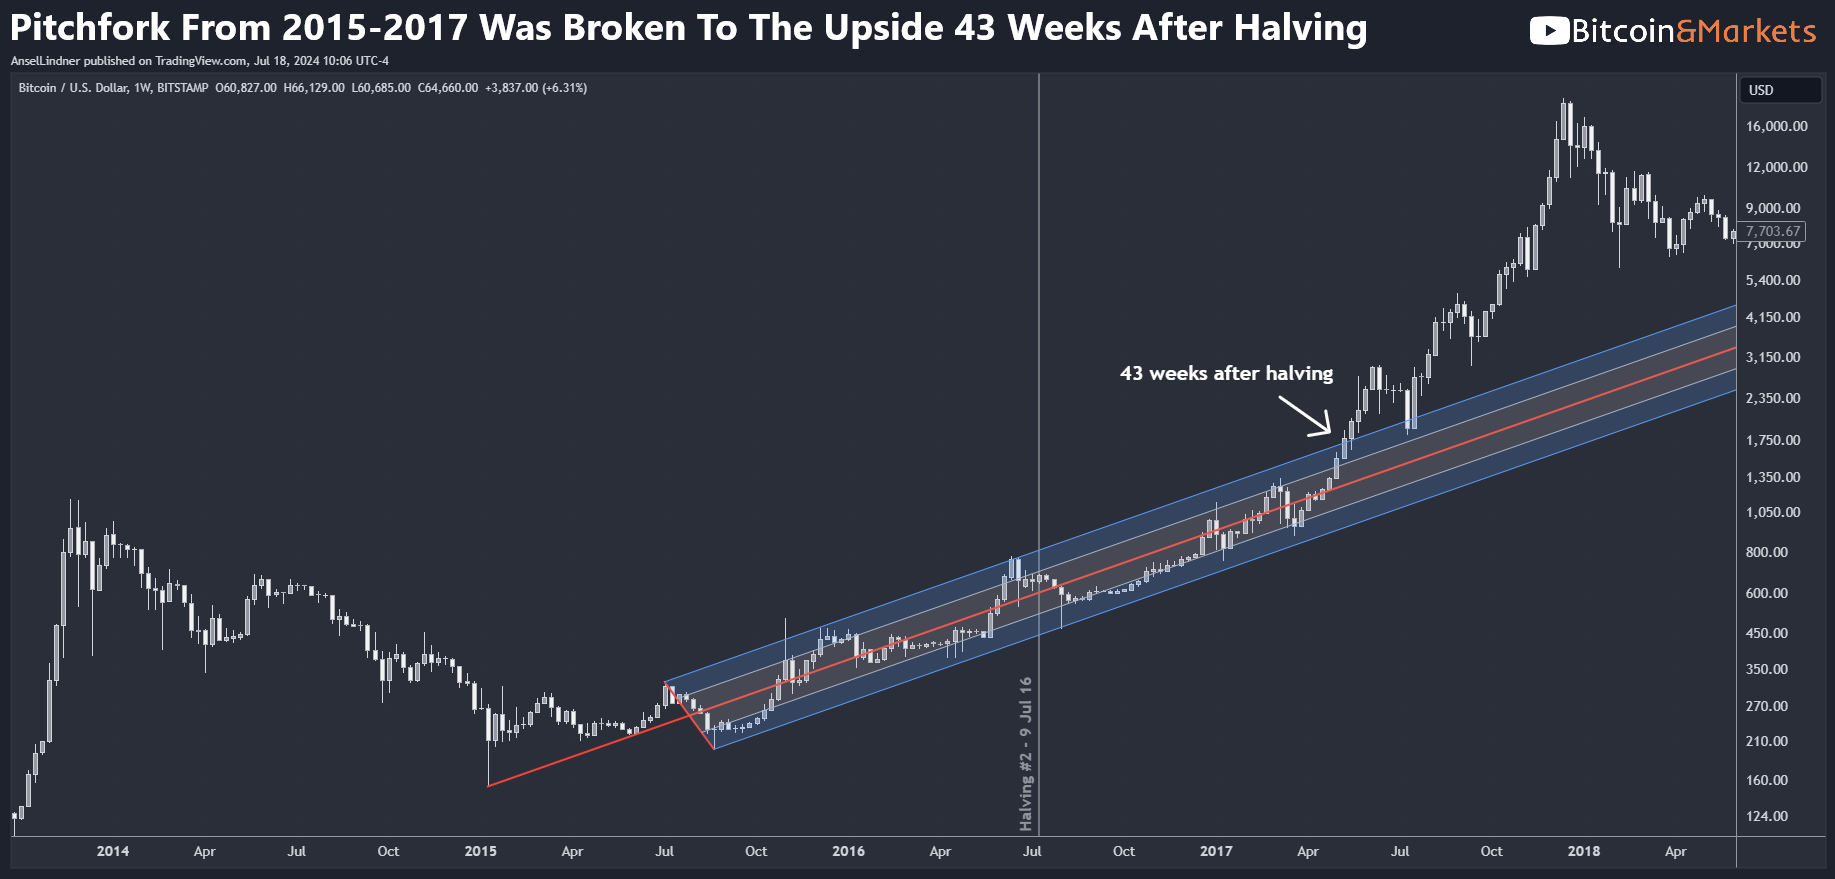
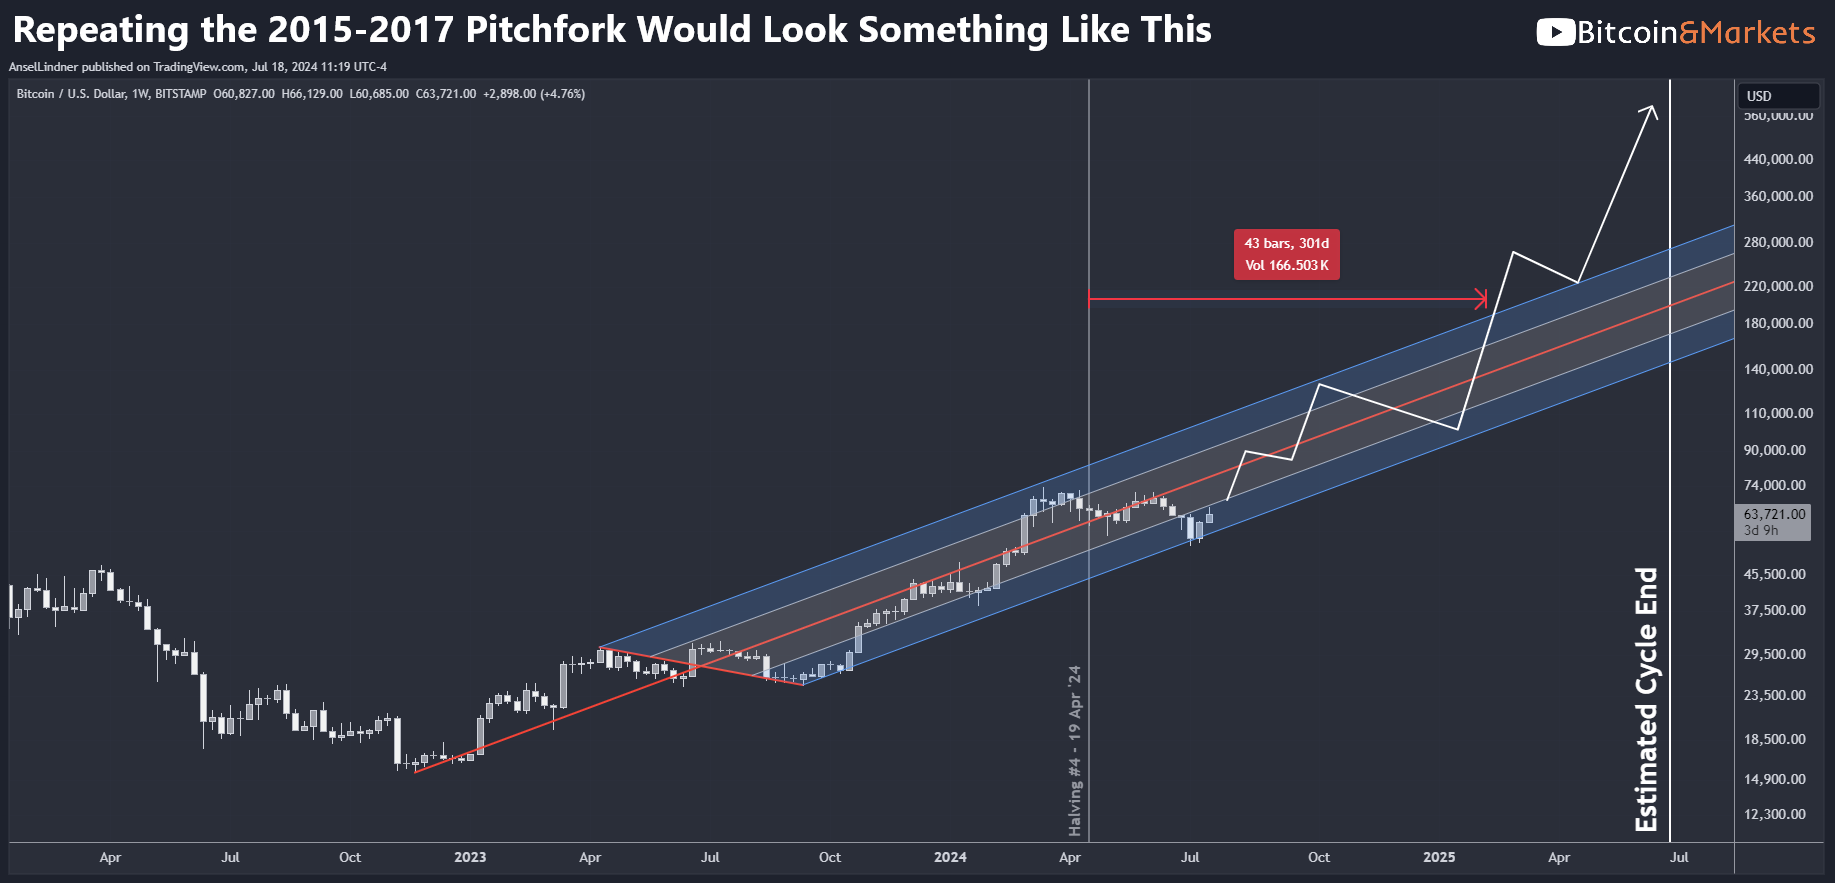
The 2015-2017 pitchfork is amazing. It contained the price in the first half of the bull market and then was broken to the upside 43 weeks after the halving. For context, today, 43 weeks after the halving is the second week of February 2025.
If we apply this to the current pitchfork it comes out something like this. The sky is the limit in this case. With all the news coming out about Trump backing Bitcoin and that he might announce a plan for a US Bitcoin reserve at the conference this month, the no-limit scenario is not far fetched.
Hold strong and have a great day,
Ansel
- Were you forwarded this post? You can subscribe here.
- Please SHARE with others who might like it!
- Join our community on Telegram!
- Become a Professional member and unlock premium content!
DONATE directly on Strike or Cash App to support my work! You make my content possible! Thank you.
Disclaimer: The content of Bitcoin & Markets shall not be construed as tax, legal or financial advice. Do you own research.