Was that the bottom? - Bitcoin Pulse #113
Let's look at Bitcoin price analysis, Wyckoff pattern, Bitmex funding bullish, TD sequential bullish, Ichimoku cloud and volume profile, Two distinct halves to the bull market analysis and more!!

ISSUE #113 | June 30, 2021 | Ansel Lindner | Disclaimer
In this issue:
- Bitcoin price analysis
- Wyckoff pattern
- Bitmex funding bullish
- TD sequential bullish
- Ichimoku cloud and volume profile
- Two distinct halves to the bull market analysis
The Bitcoin Dictionary is LIVE on Amazon!
Where else to find me : Fed Watch podcast | BTCM Research blog
Bitcoin Price |
$34,874 (-$1,100, 3.10%) |
Short term outlook (BMI) |
2 : Bullish |
Bitcoin Price Analysis
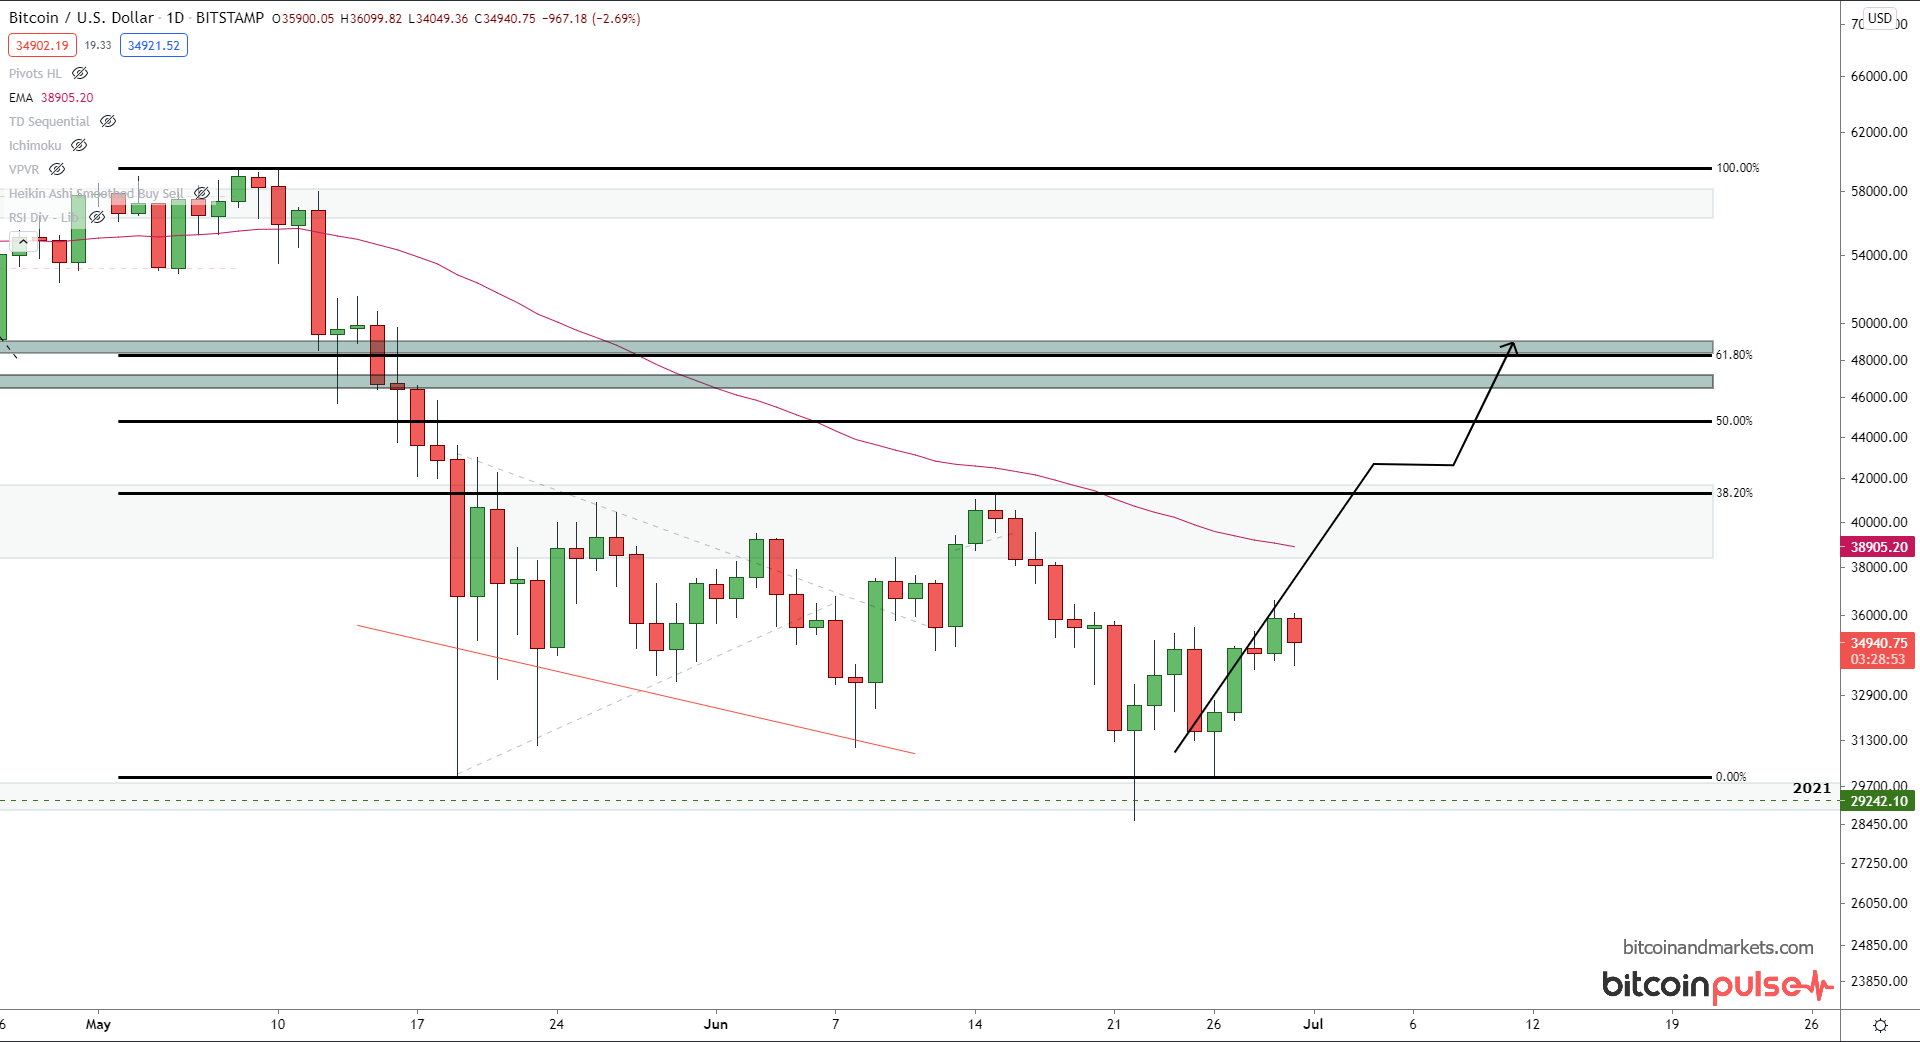
The bitcoin price has been relatively flat over the last two weeks, bouncing between our defined resistance of $40k and $30k. This is a pretty large range of 33% from the bottom. But that is what we deal with in bitcoin. These large ranges for consolidation go a long way to obscuring the influence of the fundamentals.
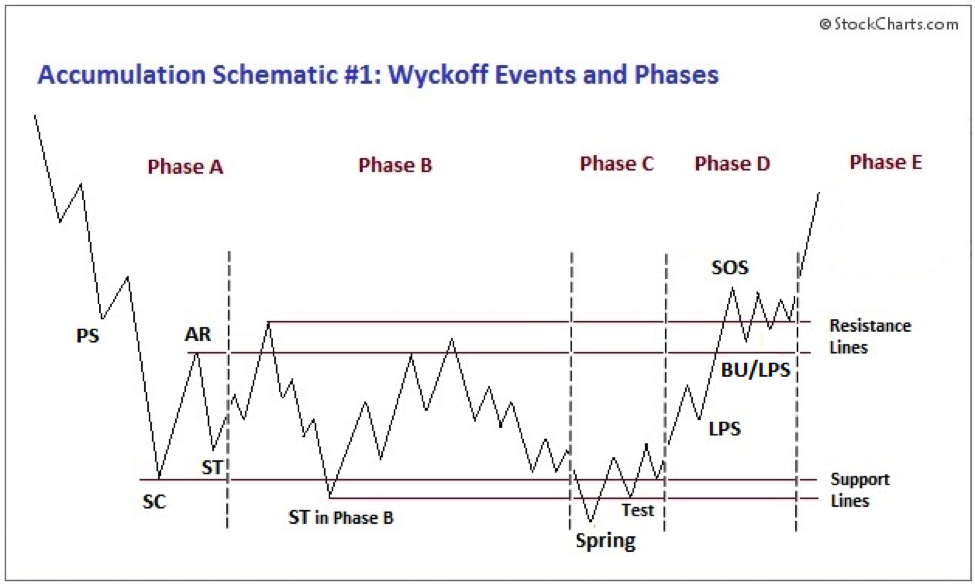
There is still a high correlation to a classic Wyckoff bottom as I pointed out on my macro update on 6/14/2021 over on BTCM.co.
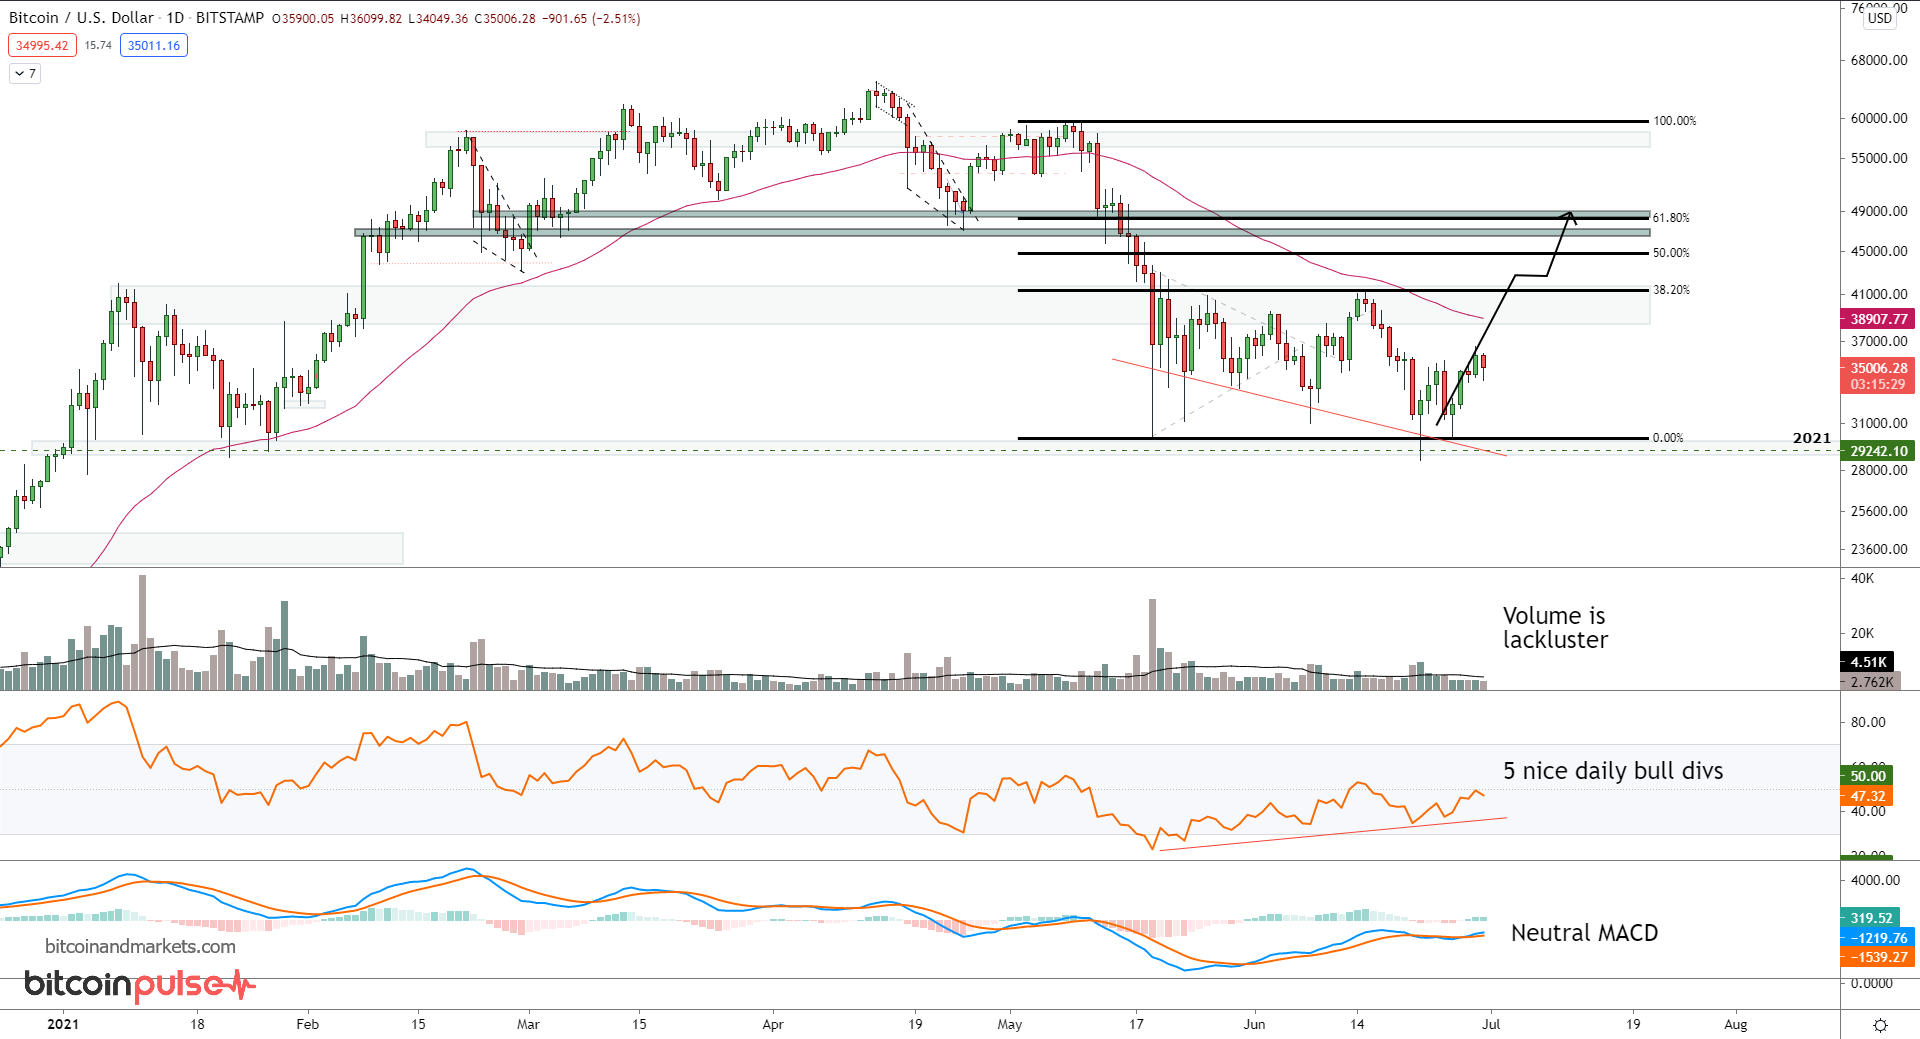
Adding in the indicators and oscillators now, volume is very lackluster, RSI is showing a very strong bullish divergence consisting of 5 consecutive divergences, which hasn't happened in such quick succession since December 2018 at the bottom of the last bear market, and the MACD is neutral to slightly bullish.
Bitmex funding rates have not been this negative for this extended period of time since last September before the large rally, and then the Corona crash.
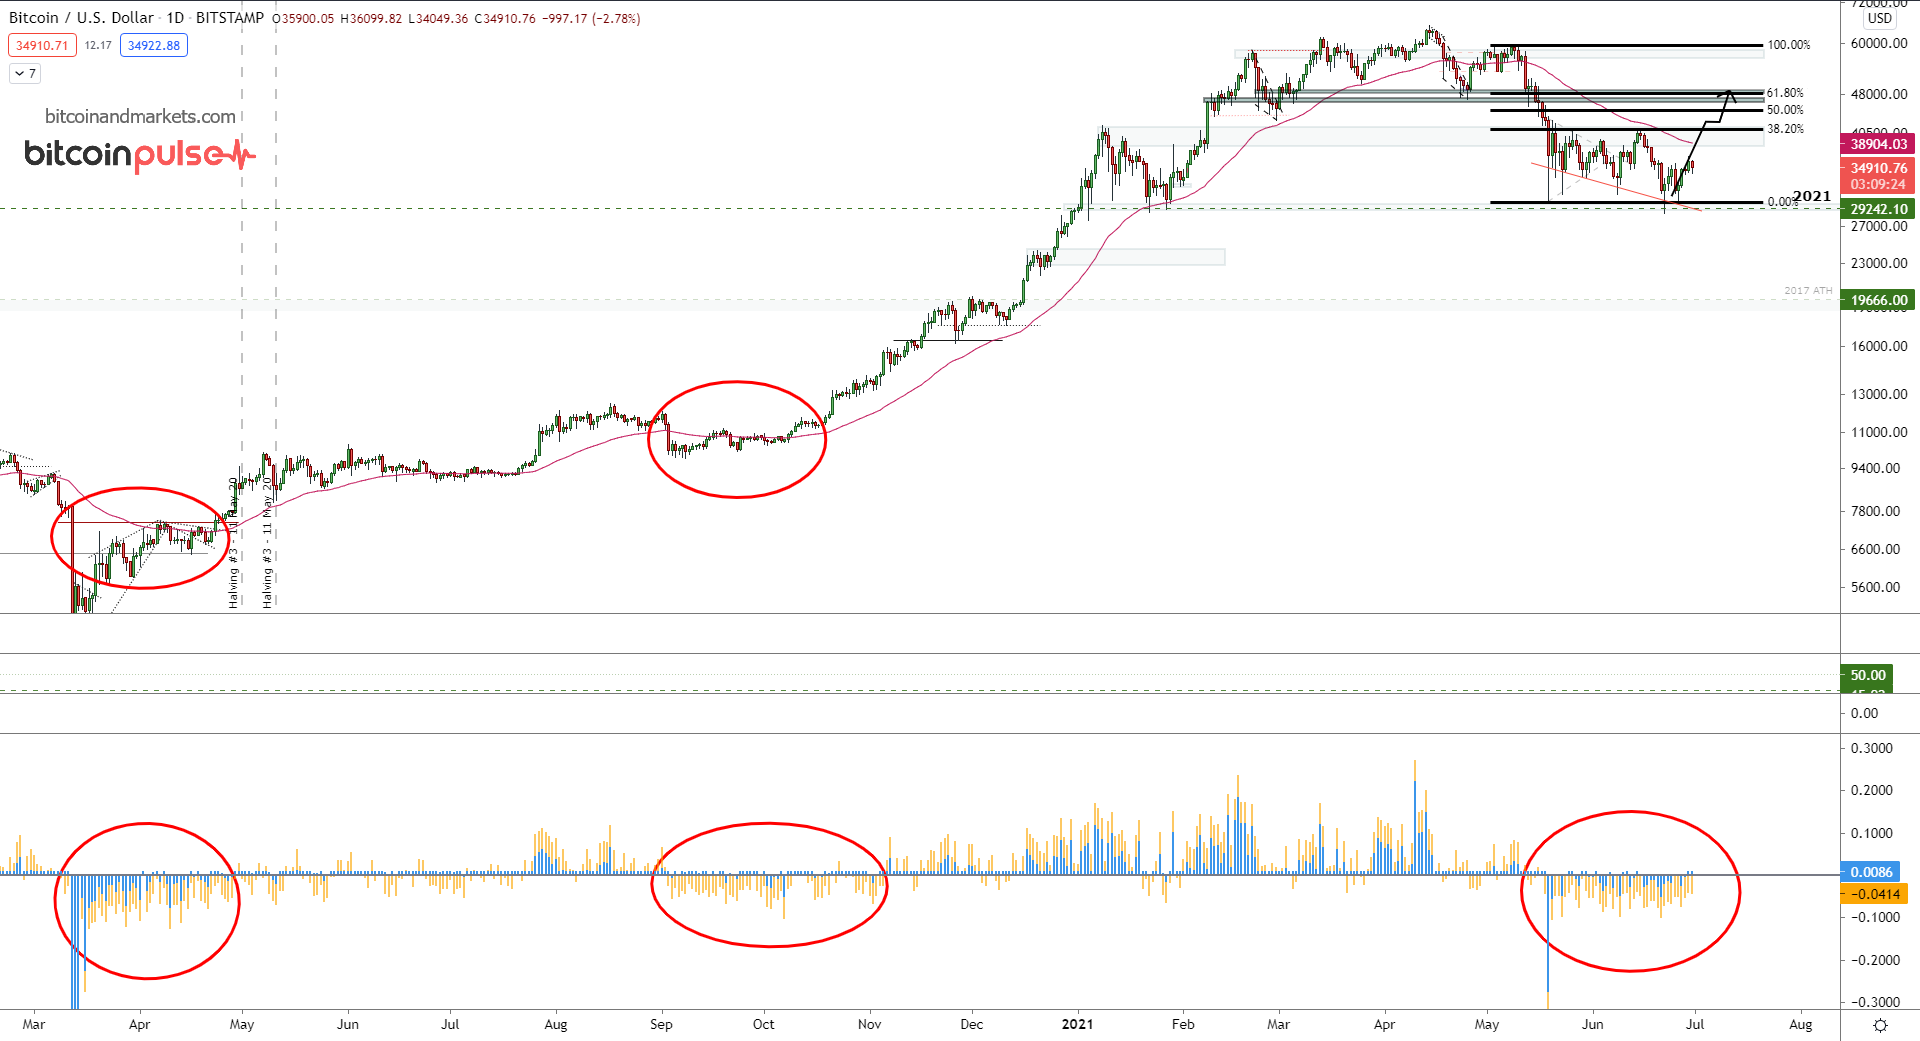
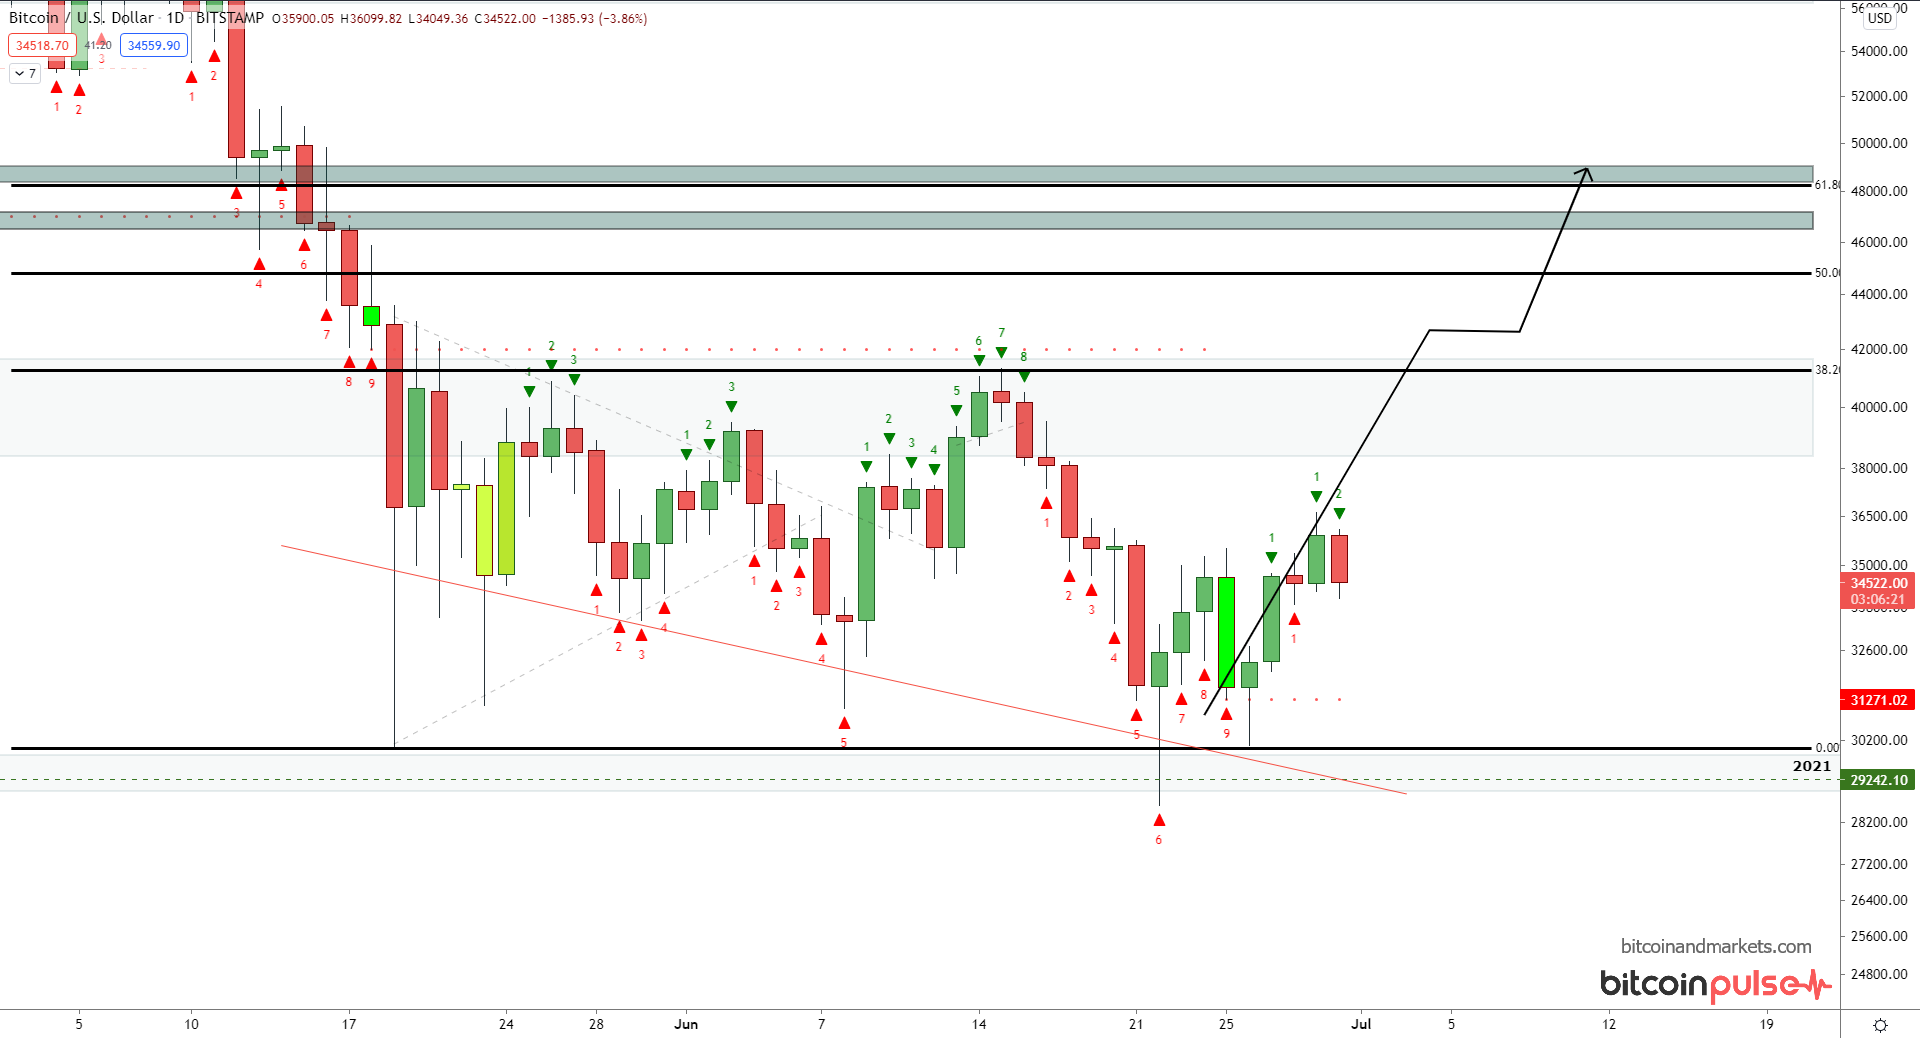
The TD sequential, a time-based trend indicator, hit a daily red 9 on the recent dip.
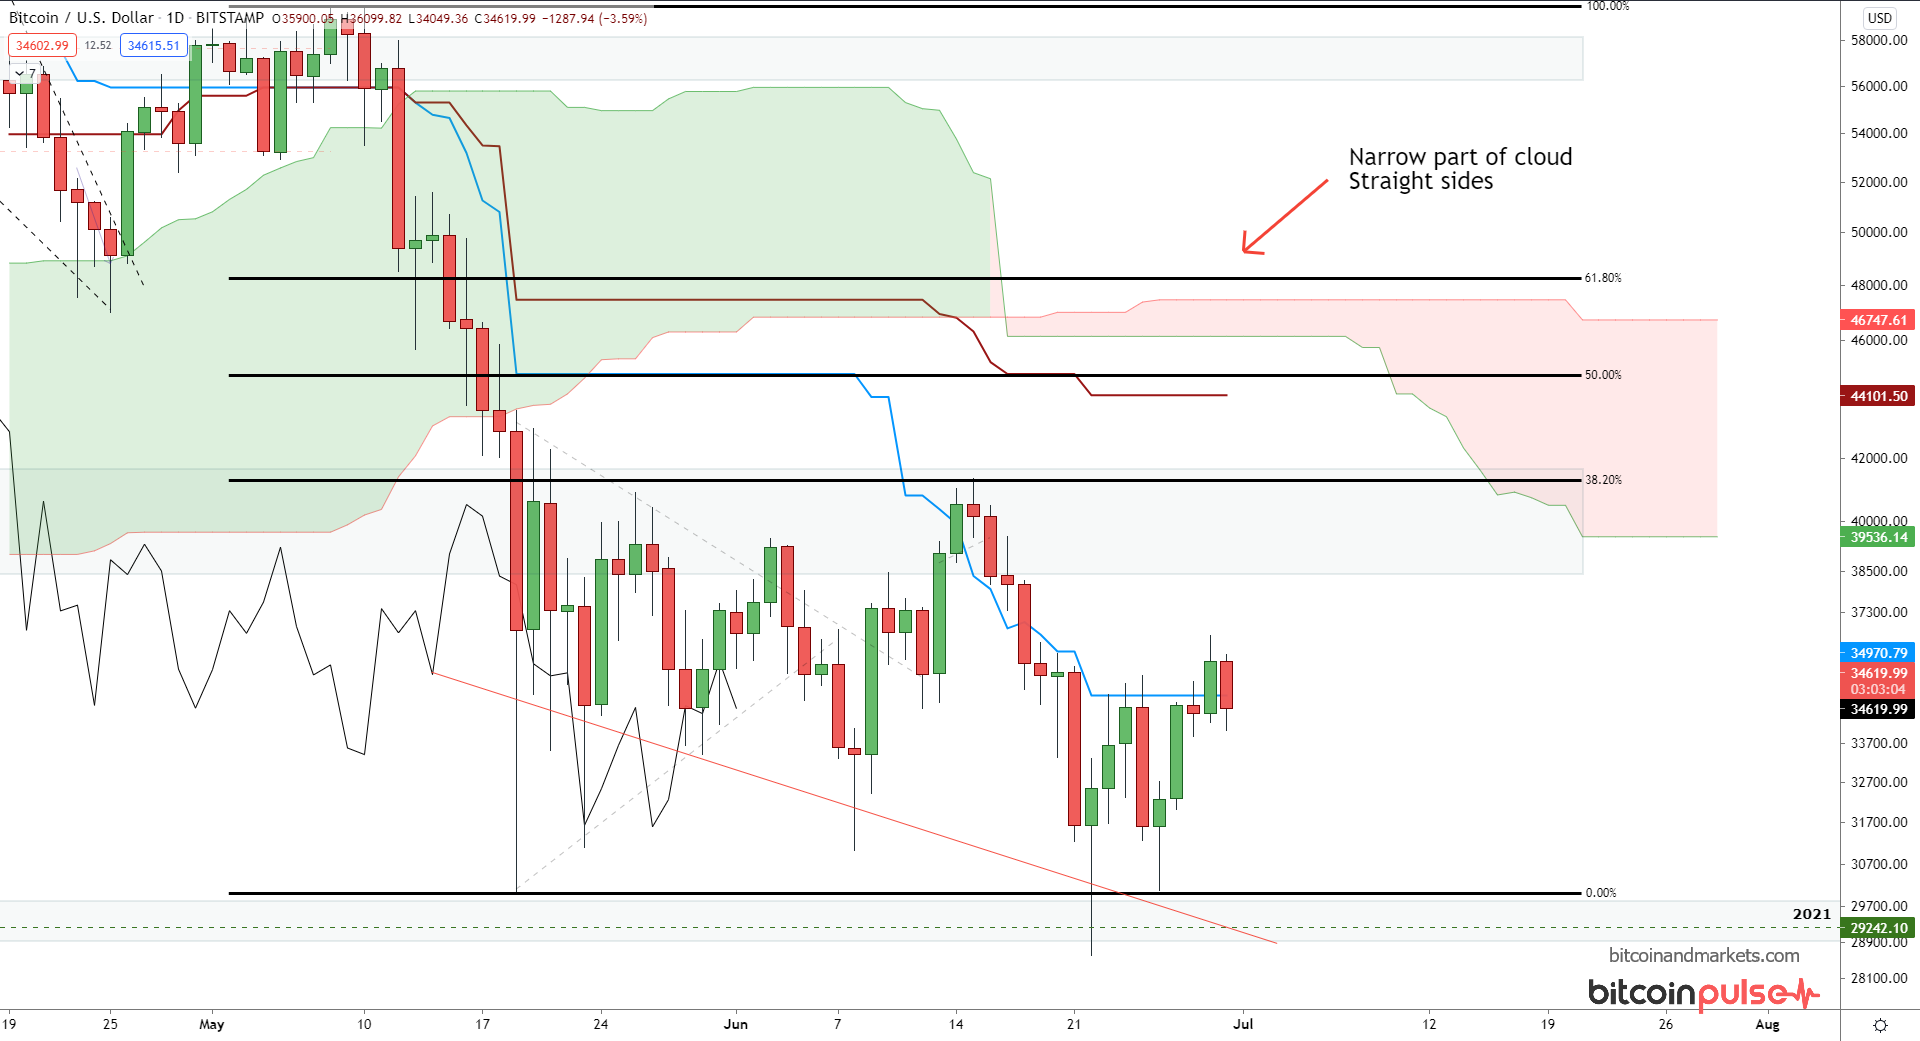
The Ichimoku cloud on the daily is showing a narrow cloud, typically indicating weaker influence. And it happens to line up right on our area of interest for any rally, right around the 61.8% retracement fib. I thought this was going to have more influence than it has. I predicted price would bounce to this area faster than it has, but there is still time to make a run for it.
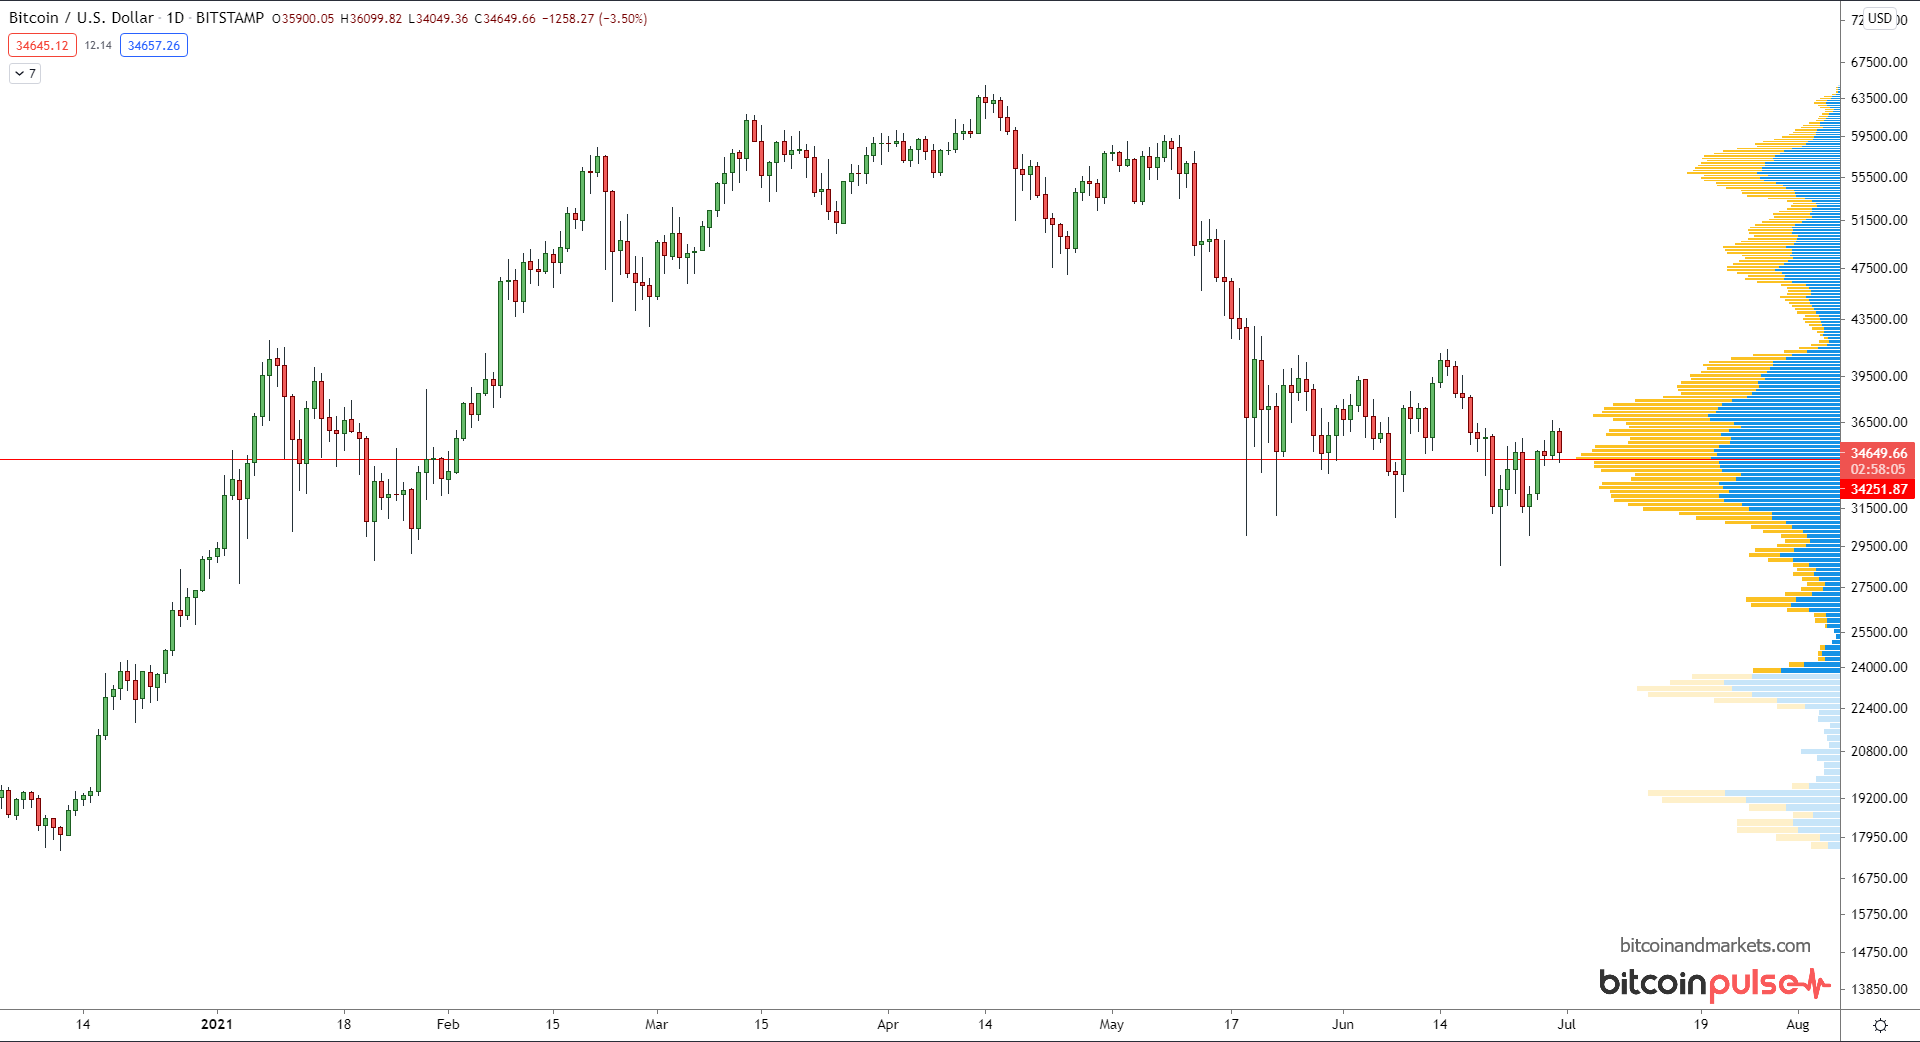
Volume by price is showing us right at the point of control. With all the wicks to the downside recently, it does appear that there is quite a bit of support below the price. It would take a significant sell off of coins I don't know if bears still have. According to the VPVR chart here, it looks as though price could slide up the volume profile to $42k easily and into our area of interest around $48k.
Other charts
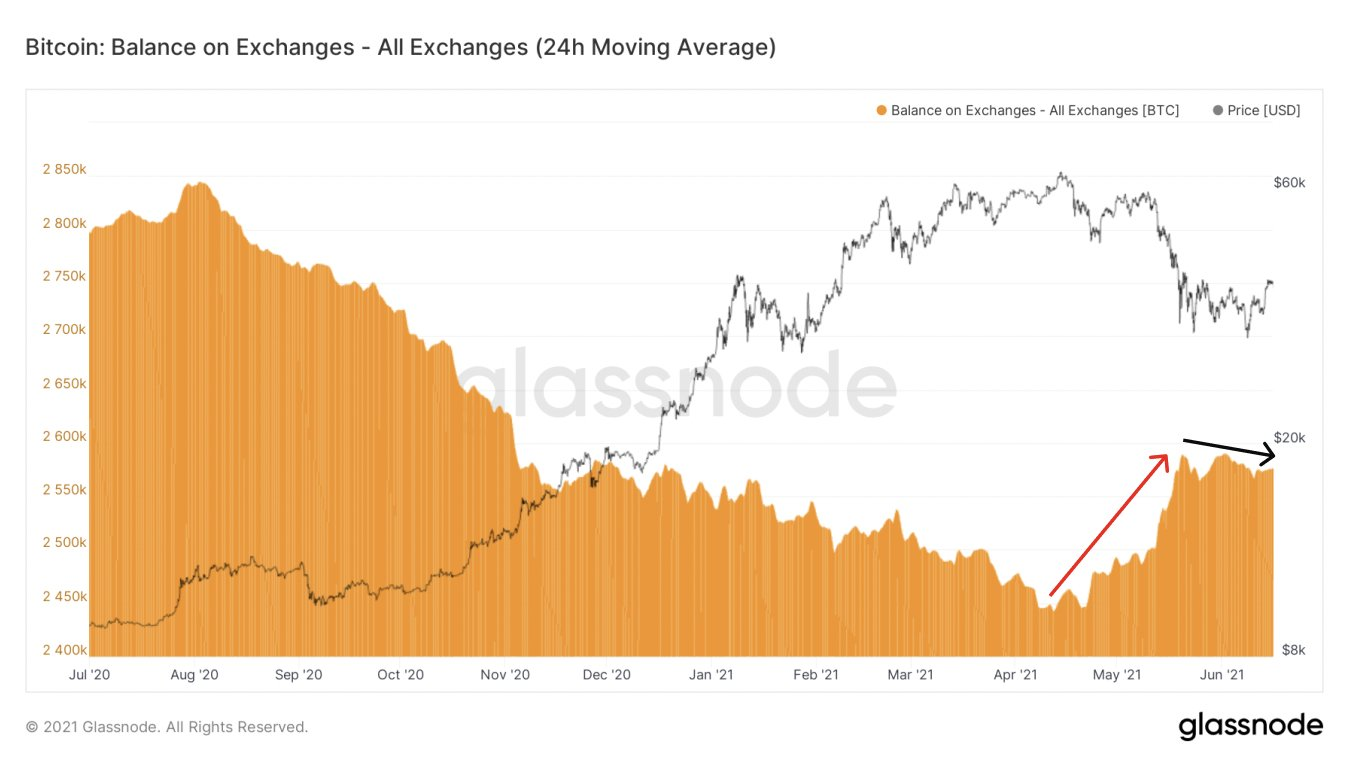
This chart from glassnode show the balance of bitcoin on exchanges and the changes we've seen throughout the rally and the sell off recently. It appears, starting in June, that the balance on exchanges has started decreasing again. The insight here, is that coins usually go to exchanges to be sold and usually leave exchanges to the held. It isn't perfect, I'd still like the see the purchasing power of the coins on exchanges.
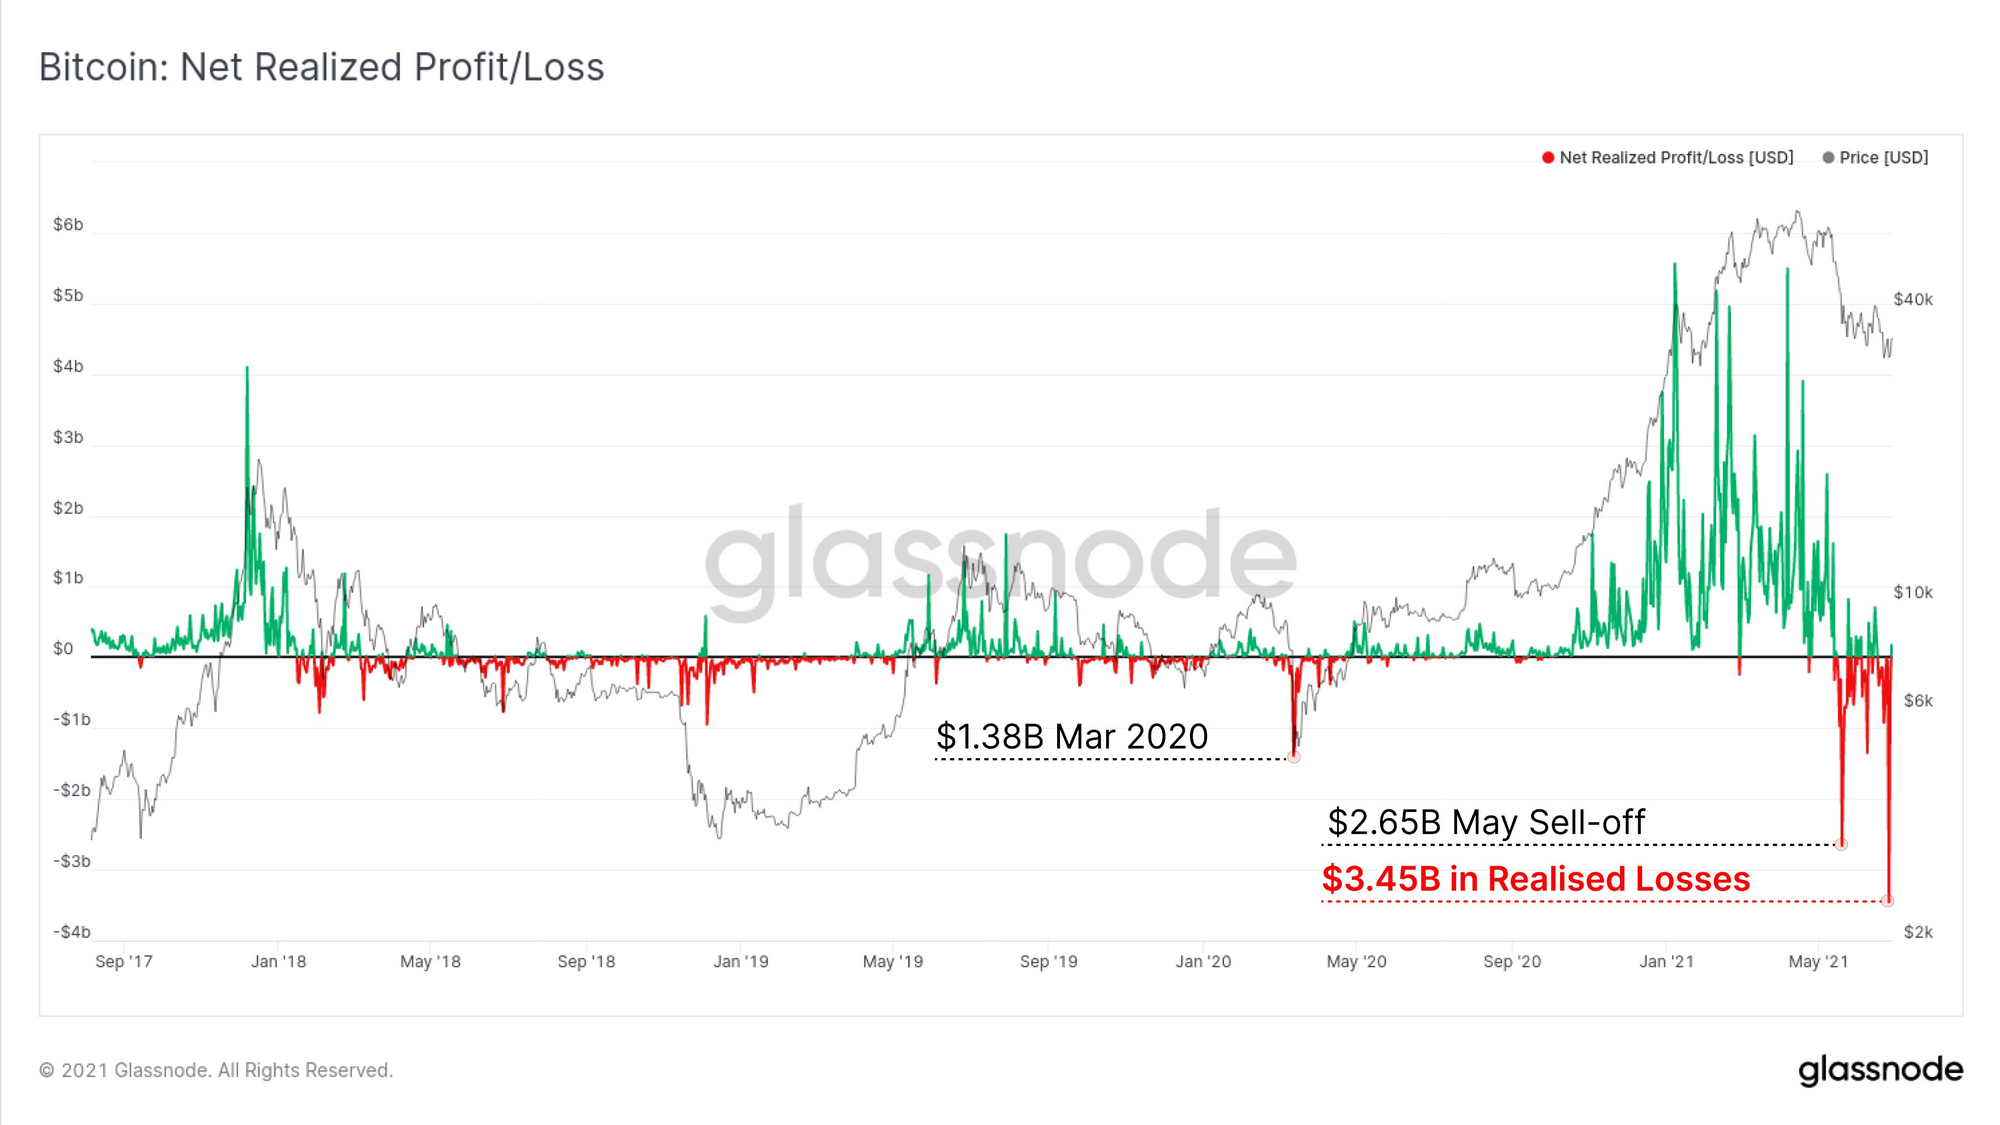
Glassnode also tracks Net Realized Profit/loss. This is a purchase price/sell price by bitcoin address on chain. They use public block chain data to estimate this number. They say last week was the largest single day loss on record for this metric, meaning more sold to realize a loss than ever before. REKT
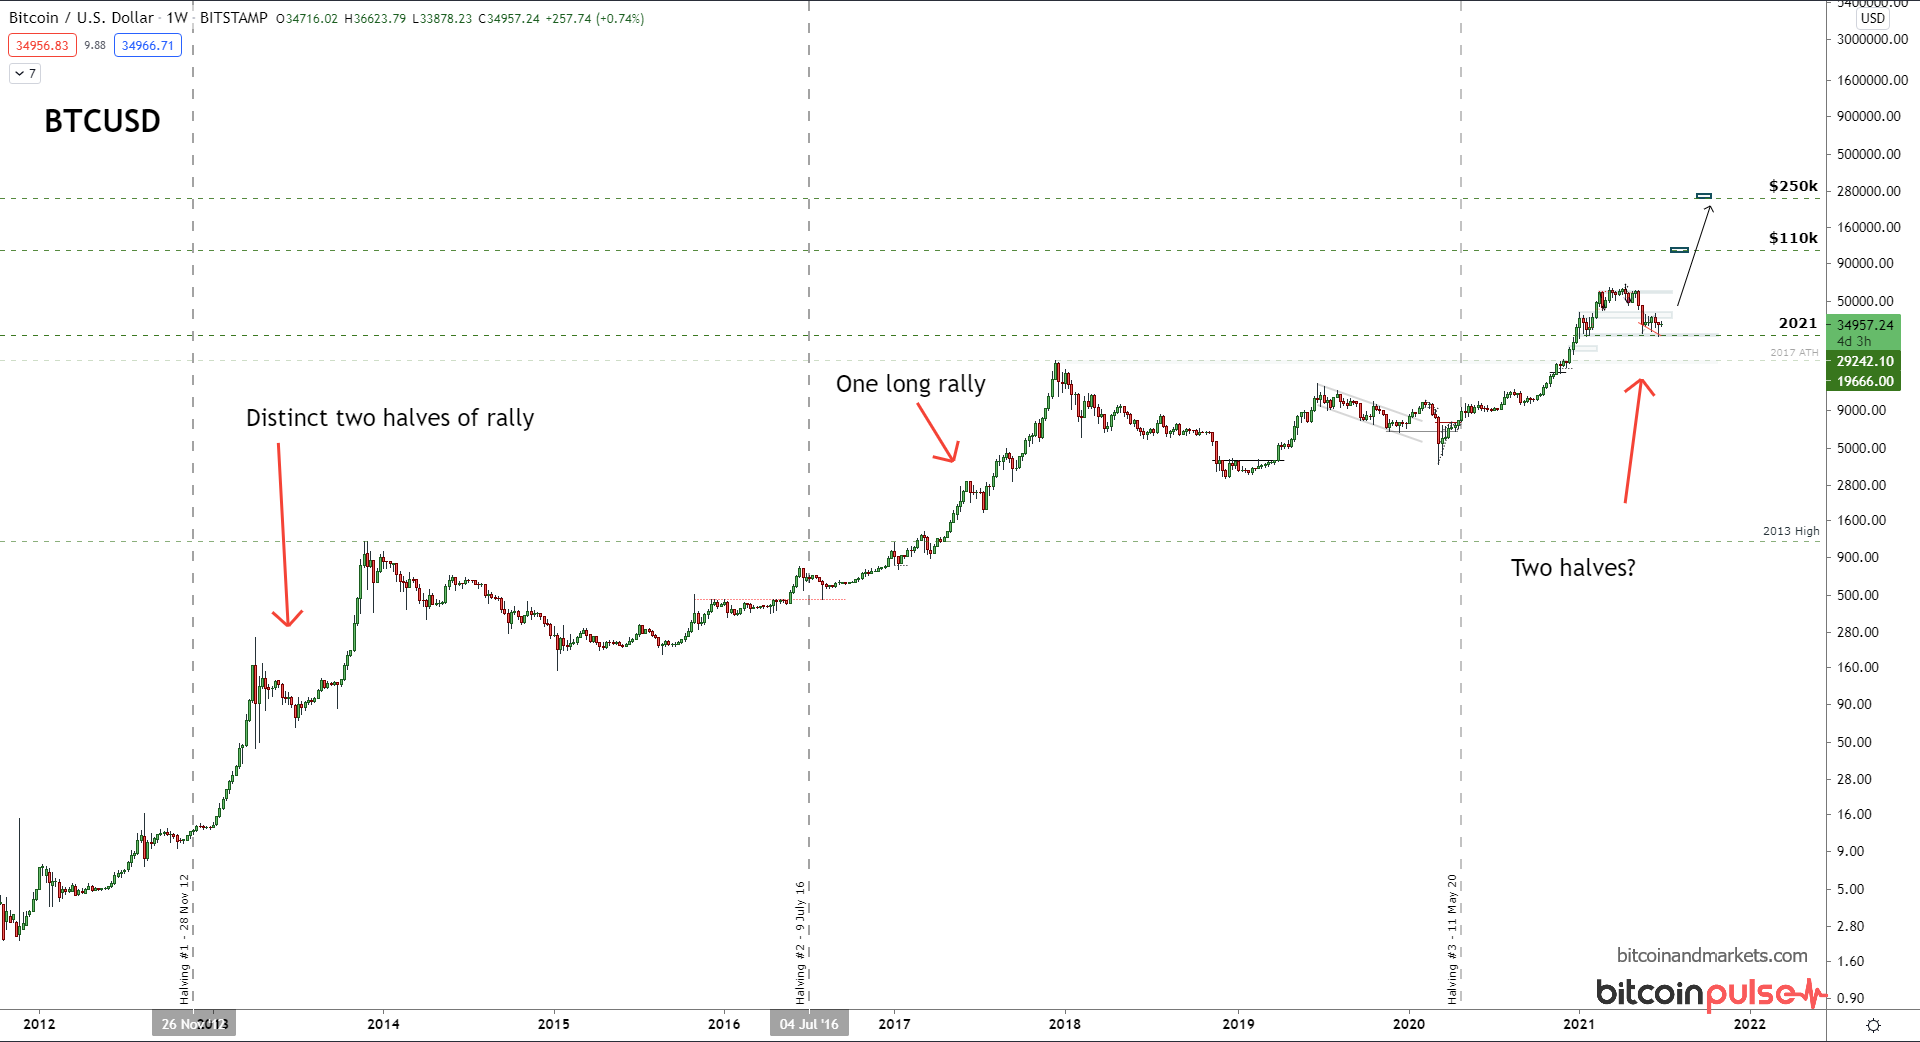
2013 vs 2017 vs 2021
This was a debate I had early in this rally, as it appeared price was outpacing the 2017 rally. It has kind of passed into the background now, but it does look like we could be setting up for a distinct second half of the rally in this cycle, just like 2013. If this is to play out, we'd be looking at $250,000 or so by the end of the year?!
Overall
My forecast is for the Wyckoff pattern to work pretty well, and price to trace a path up to our area of interest around $48k in the near term.
The fundamentals on adoption are very stout. If price does start to rally and break some major levels, it will quickly become self-reinforcing to the upside. Bitcoin will become very scarce and price will have to rocket higher.
One interesting curve ball is the mining situation in China. Difficulty is about to adjust down by 25%+ which makes it the largest difficulty drop in the history of bitcoin I think. When that happens, and the network is just fine, then in a few weeks hash rate starts coming back online in a big way, it could be the shot of confidence we need.
VITAL STATS
Takeaways
- Difficulty bomb coming
- Network traffic manageable
- Stock to flow and Mayer multiple EXTREME buy range!!!
- Forex signaling trend change, stronger dollar
Want to see a specific metric I don't include? Let me know.
Pricing
| Market Cap | $0.655 trillion |
| Market cap (AU/oz) | 370.8 million troy ounces |
| Market cap (AU/tons) | 11,533 |
| Sats/$ | 2,859 |
| Finney (1/10,000 btc) | $3.50 |
| Miner Revenue per day | $21.9 mil |
Investment Indicators
| GBTC Premium | -6.9% (improving, very low) |
| Stock to Flow Multiple (10d) | 0.09 (EXTREME buy zone) |
| Mayer Multiple | 0.79 (EXTREME buy zone) |
| ROI 3 mo | -40% |
| ROI 52 wk | 279% |
CME Futures
| Front Month Expiry | 30 July 2021 |
| Total Open Interest | 6,788 (-700 from last issue, extremely low) |
Network
| Network volume 24h | 1.2 million btc (low normal) |
| Est. Difficulty adjustment | -27% in 1 days |
| Difficulty Last 3 Avg | -3.08% |
| Avg block size (daily) | 1.4 MB (full) |
| Avg transaction $ value | $85,067 (2.43 btc) (low) |
| Median trx value | $947.62 (0.027 btc) (avg) |
| Avg $ fee/transaction | $9.92 (2.83 finneys, 80 sats/b) (high avg) |
| Median fee | $4.66 (1.33 finneys) (avg) |
Stablecoin dominance (might discontinue this one)
| Tether dominance (vs all altcoins) | TBD |
| Stablecoin dominance | TBD |
| Stablecoin/bitcoin | TBD |
Top Forex Crosses
| DXY | 92.39 |
| EURUSD | 1.1851 |
| USDCNY | 6.4566 |
| Gold/USD | $1,768 |
| Silver/USD | $26.08 |
Where else to find me : Fed Watch podcast | BTCM Research blog
The Bitcoin Dictionary is LIVE on Amazon!
Thanks!
A