Fibs and Vitals - Bitcoin Pulse #115
In this issue, as always bitcoin price analysis, charts, and vital fundamentals, as well as, Fibonacci lines for cycles and current correction.

ISSUE #115 | July 22, 2021 | Ansel Lindner | Disclaimer
In this issue:
- Bitcoin price analysis and Vital Fundamentals
- Fibonacci lines for cycles and current correction
The Bitcoin Dictionary is LIVE on Amazon!
Where else to find me : Fed Watch podcast | BTCM Research blog
Bitcoin Price |
$32,407 (+$250, 0.8%) |
Short term outlook (BMI) |
1 : Slightly bullish |
Hello members,
Thank you for your support. If you haven't yet, please see my recent post on Bitcoin Magazine, How Bitcoin Will Impact El Salvador's Geopolitics. And please share to get sober analysis about bitcoin out there to the broader community.
Bitcoin Price Analysis
Fun With Fibs
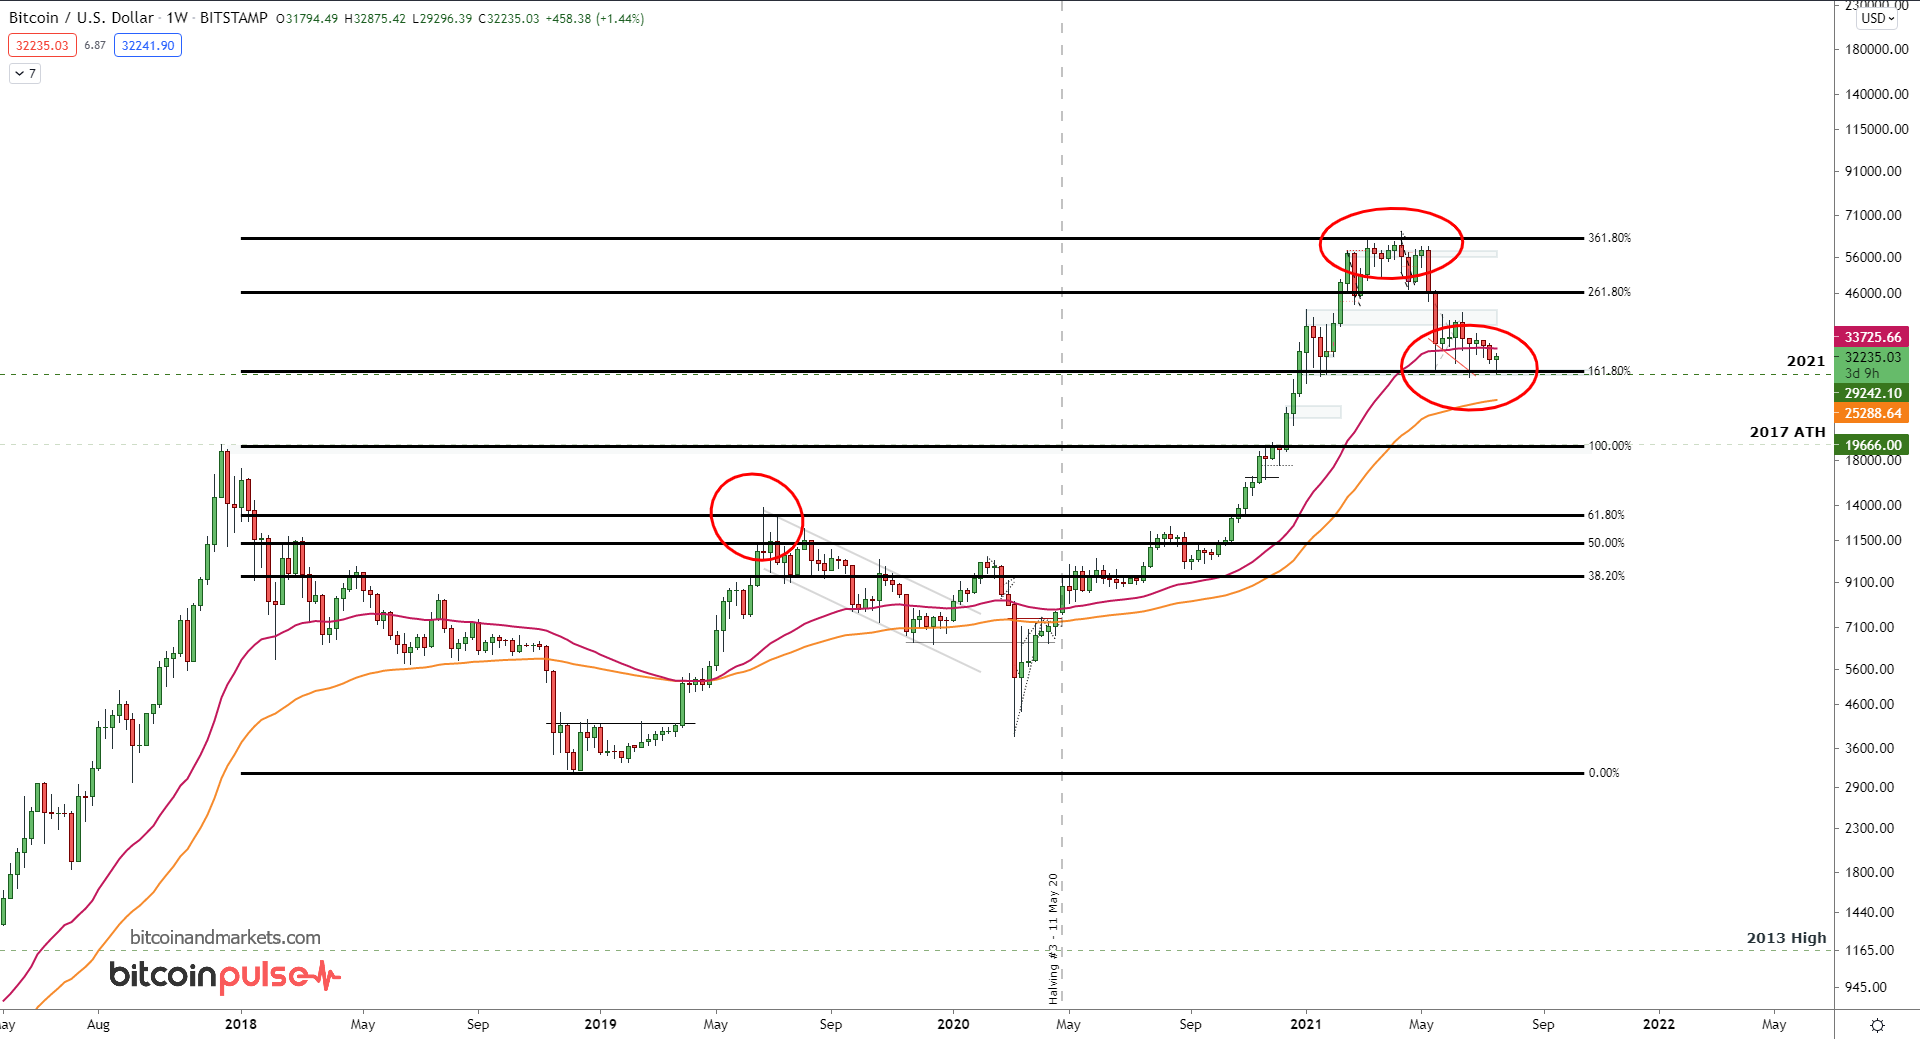
Let's jump right in. The first chart today is a weekly chart of bitcoin, with Fibs drawn from the 2017 top, to the bottom in 2018. As you can see the rally in 2019 completed a 61.8 retrace perfectly. The most recent high also corresponded with the 361.8 extension fib and the current price action is being held up by the 161.8 fib.
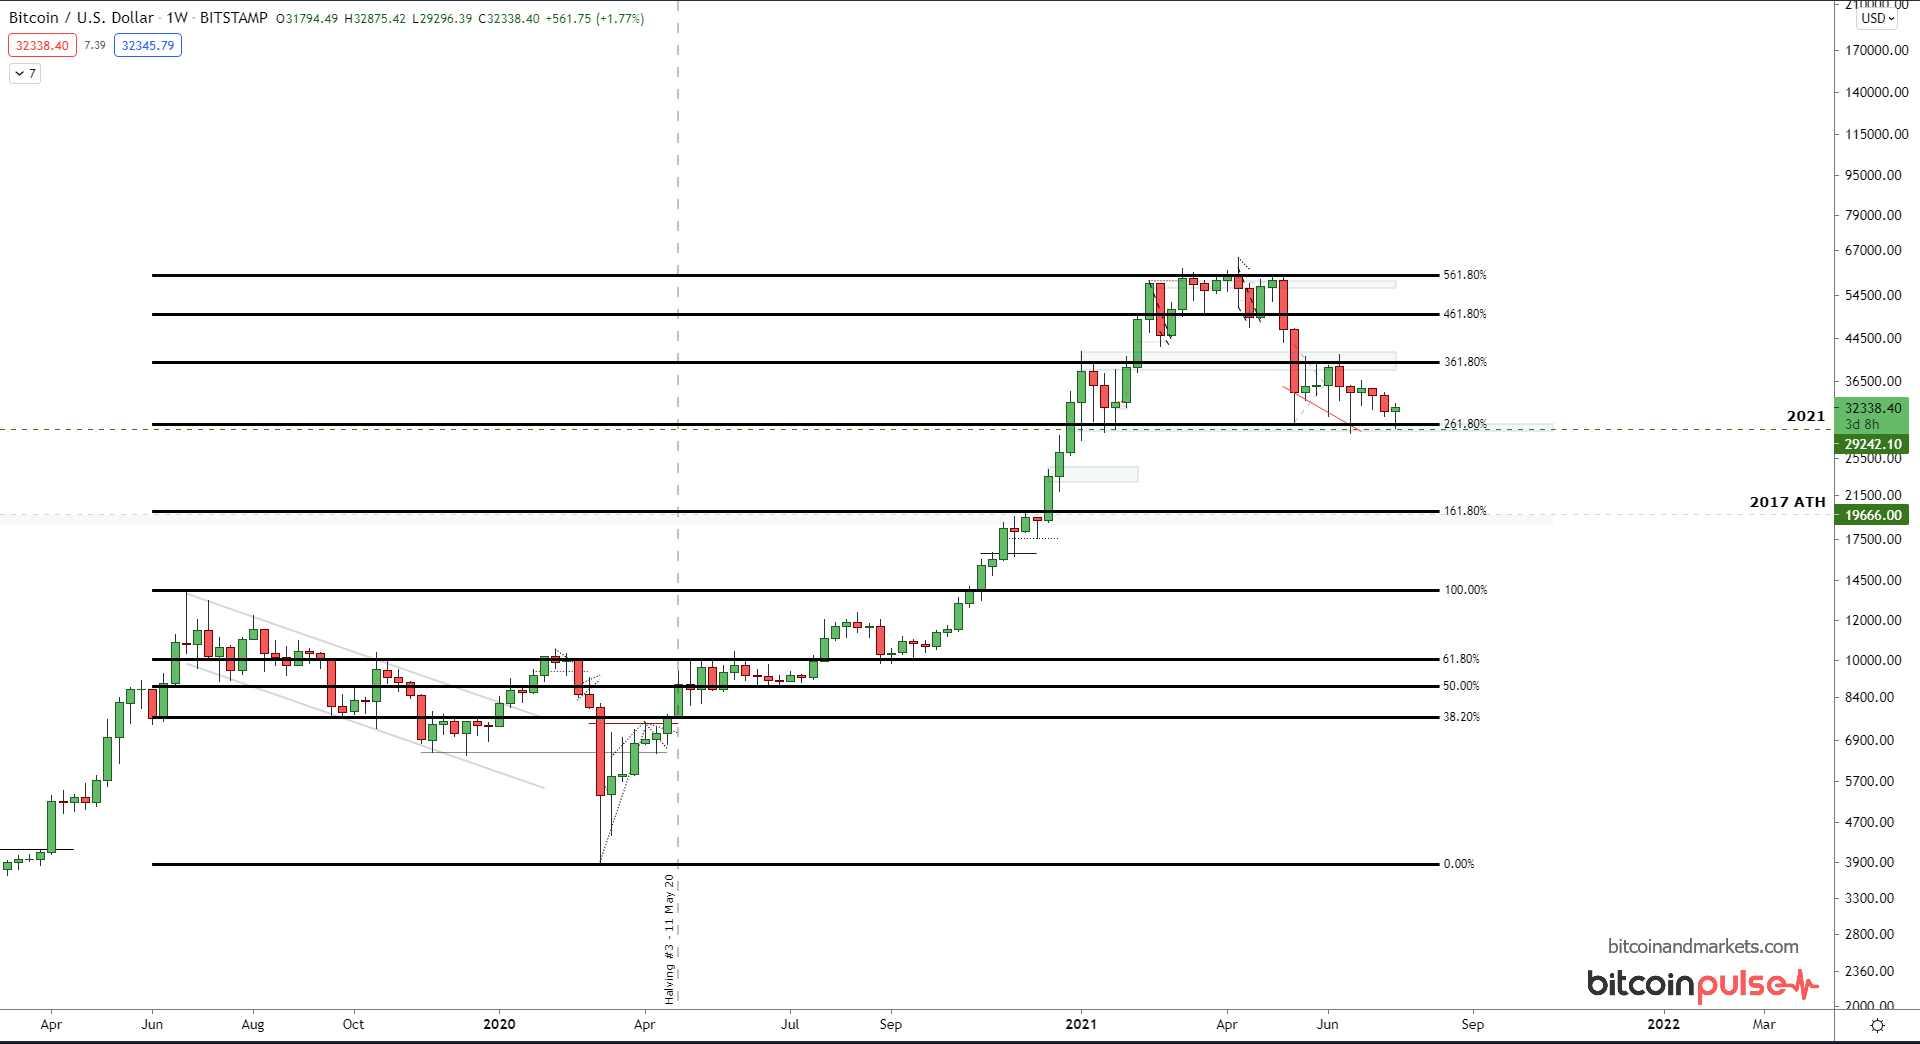
Now using 2019 high to the corona crash bottom we get these fibs below. Again, notice the top was roughly on a 61.8 extension, namely the 5.618. And we have corrected back down to the 2.618. Also, each fib lines up very nicely with previous marked support/resistance zones found through other TA.
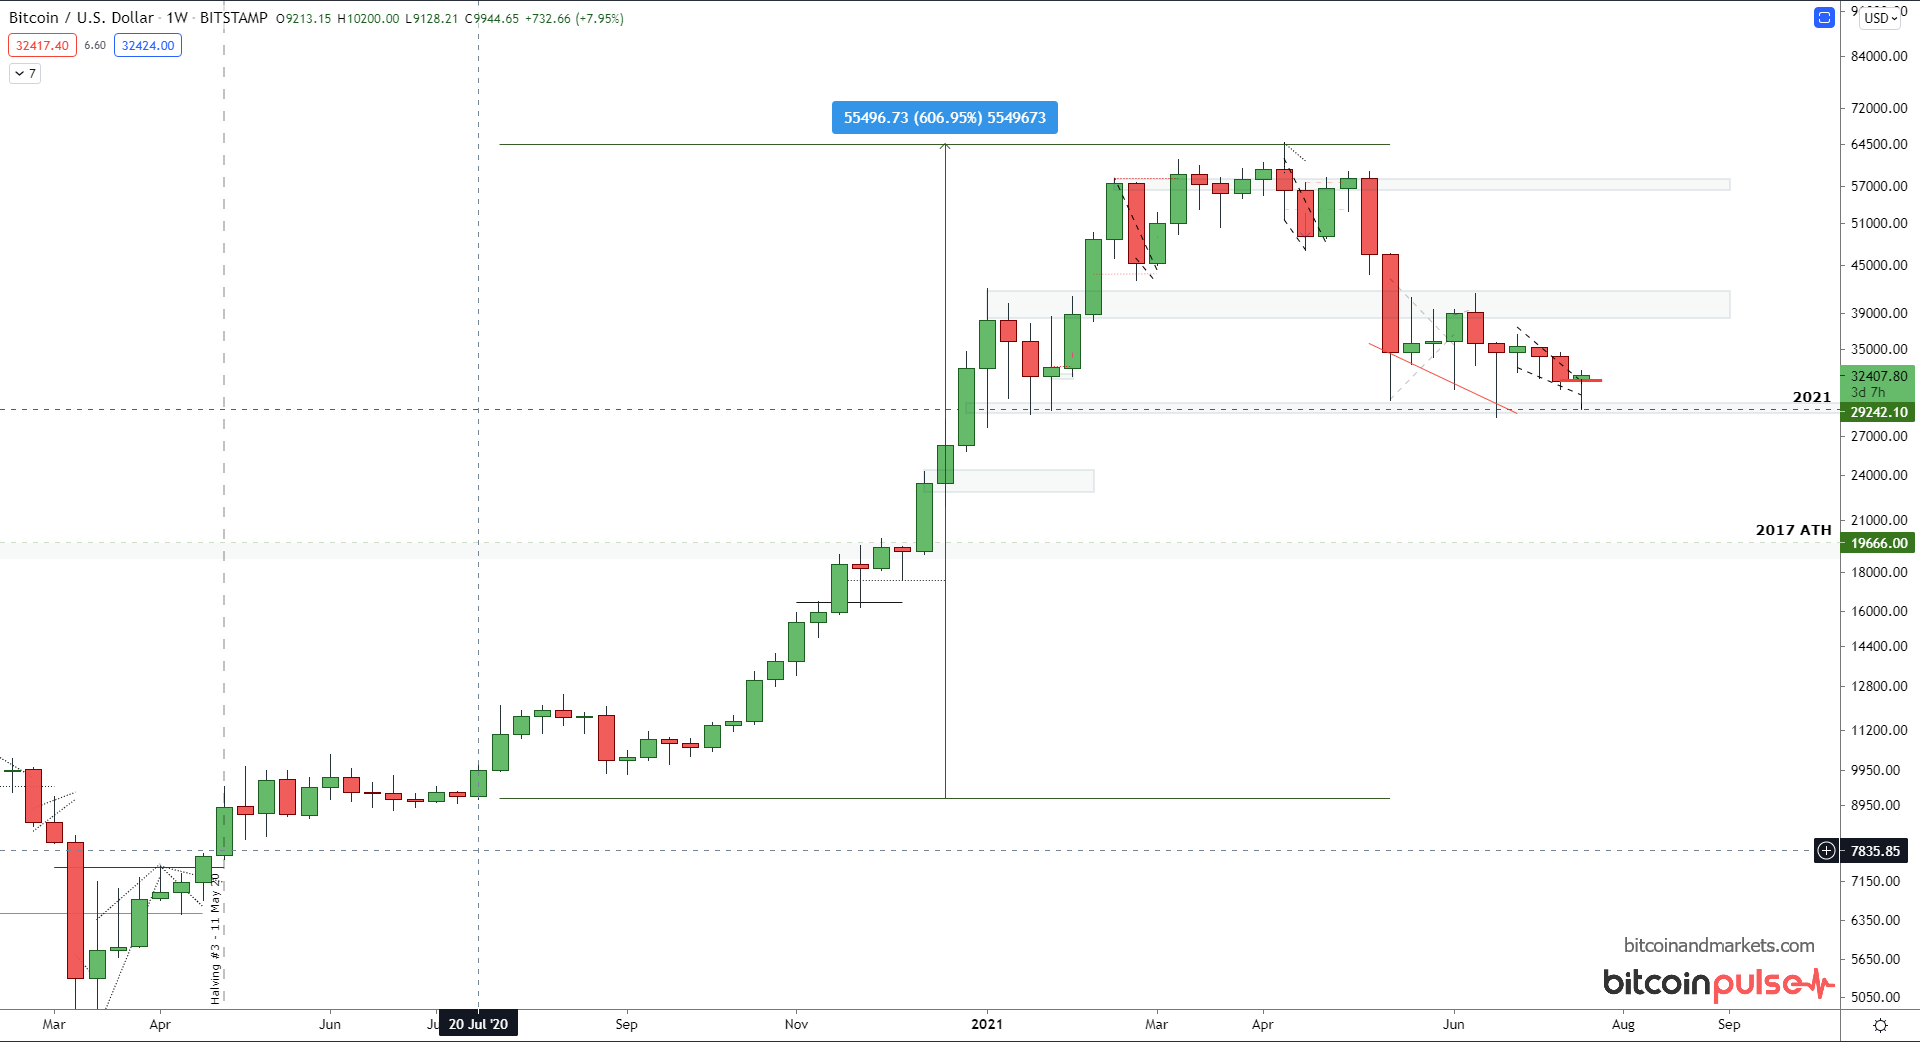
The current retrace also aligns decently with fibs. I've included two possibilities below. We see in the black lines from the corona crash bottom to the $64k top, the 61.8 retracement is barely below price. However, it's close, and if we fudge things a little, either from the weekly close of the corona crash, or the halving price (red lines) the current correction is almost exactly at the 61.8.
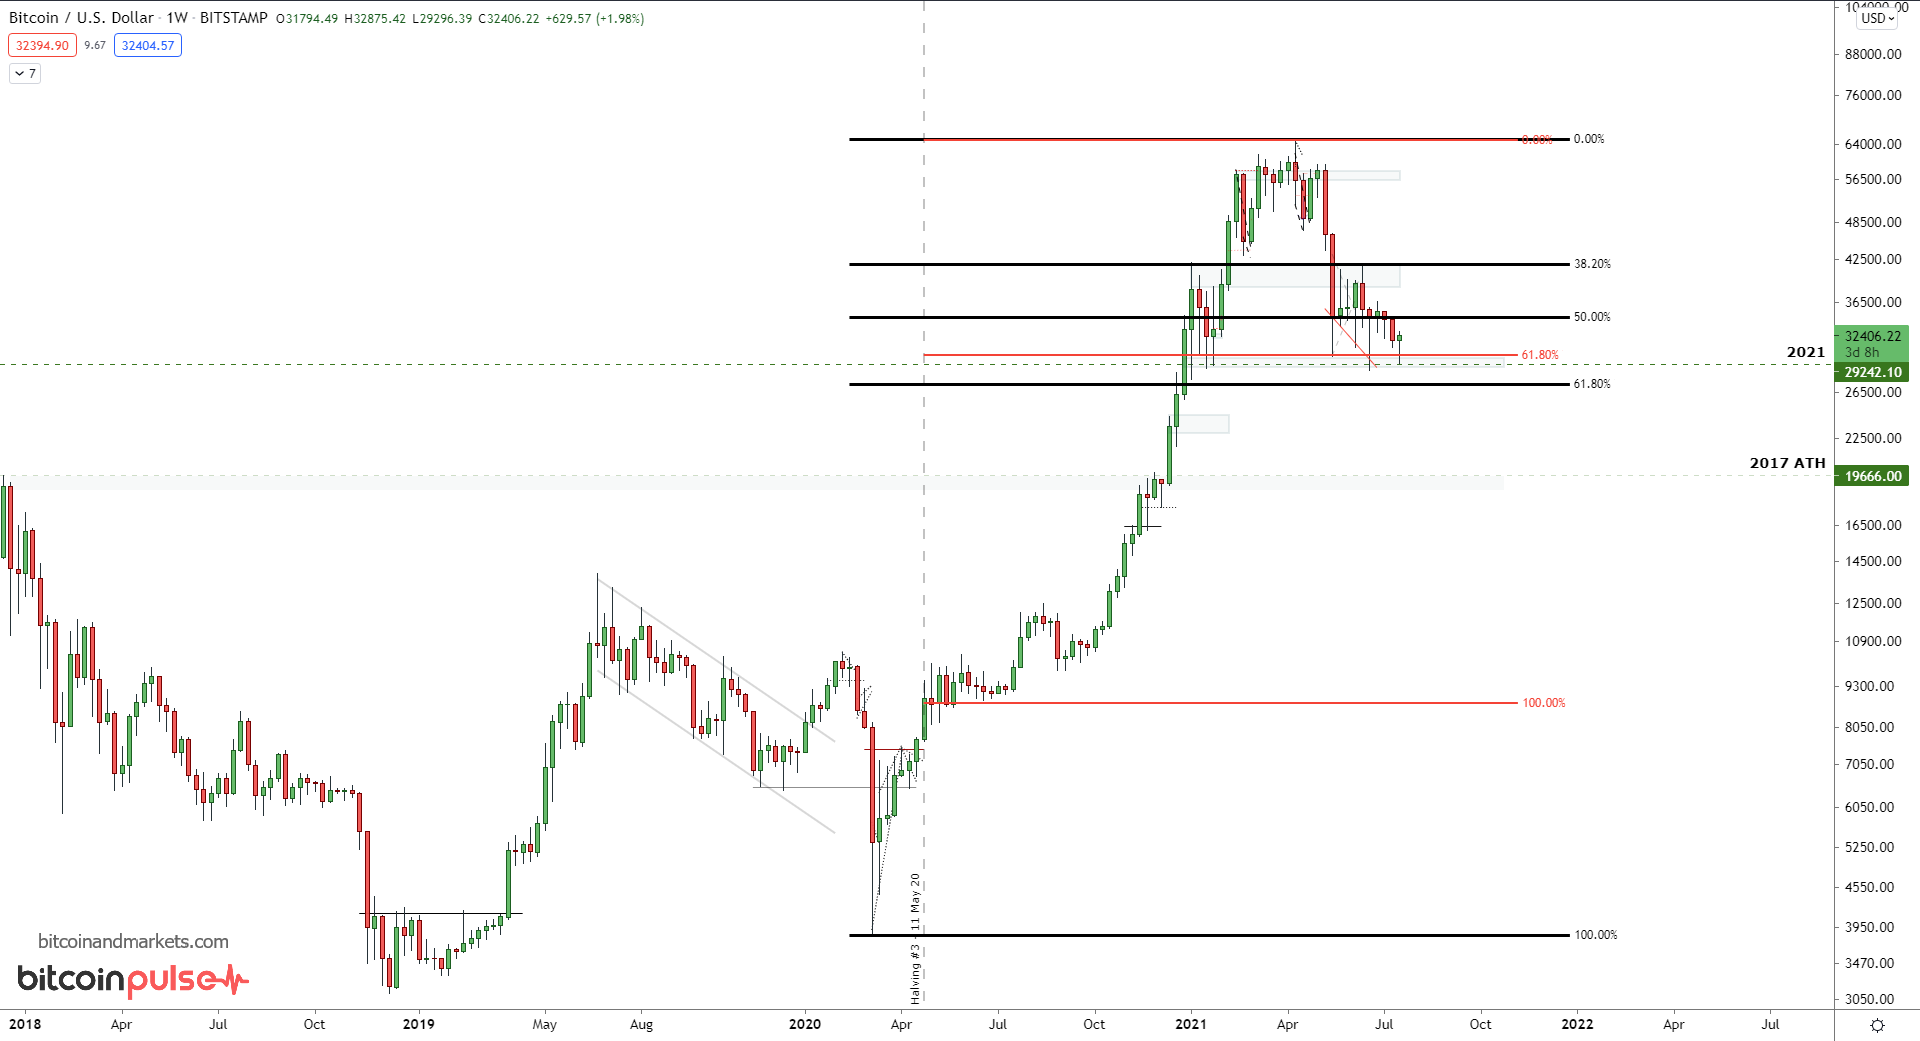
Here's what it looks like if we do the same extension out to 5.618 onto recent price action. The extension falls in the ballpark of my general target for this cycle.
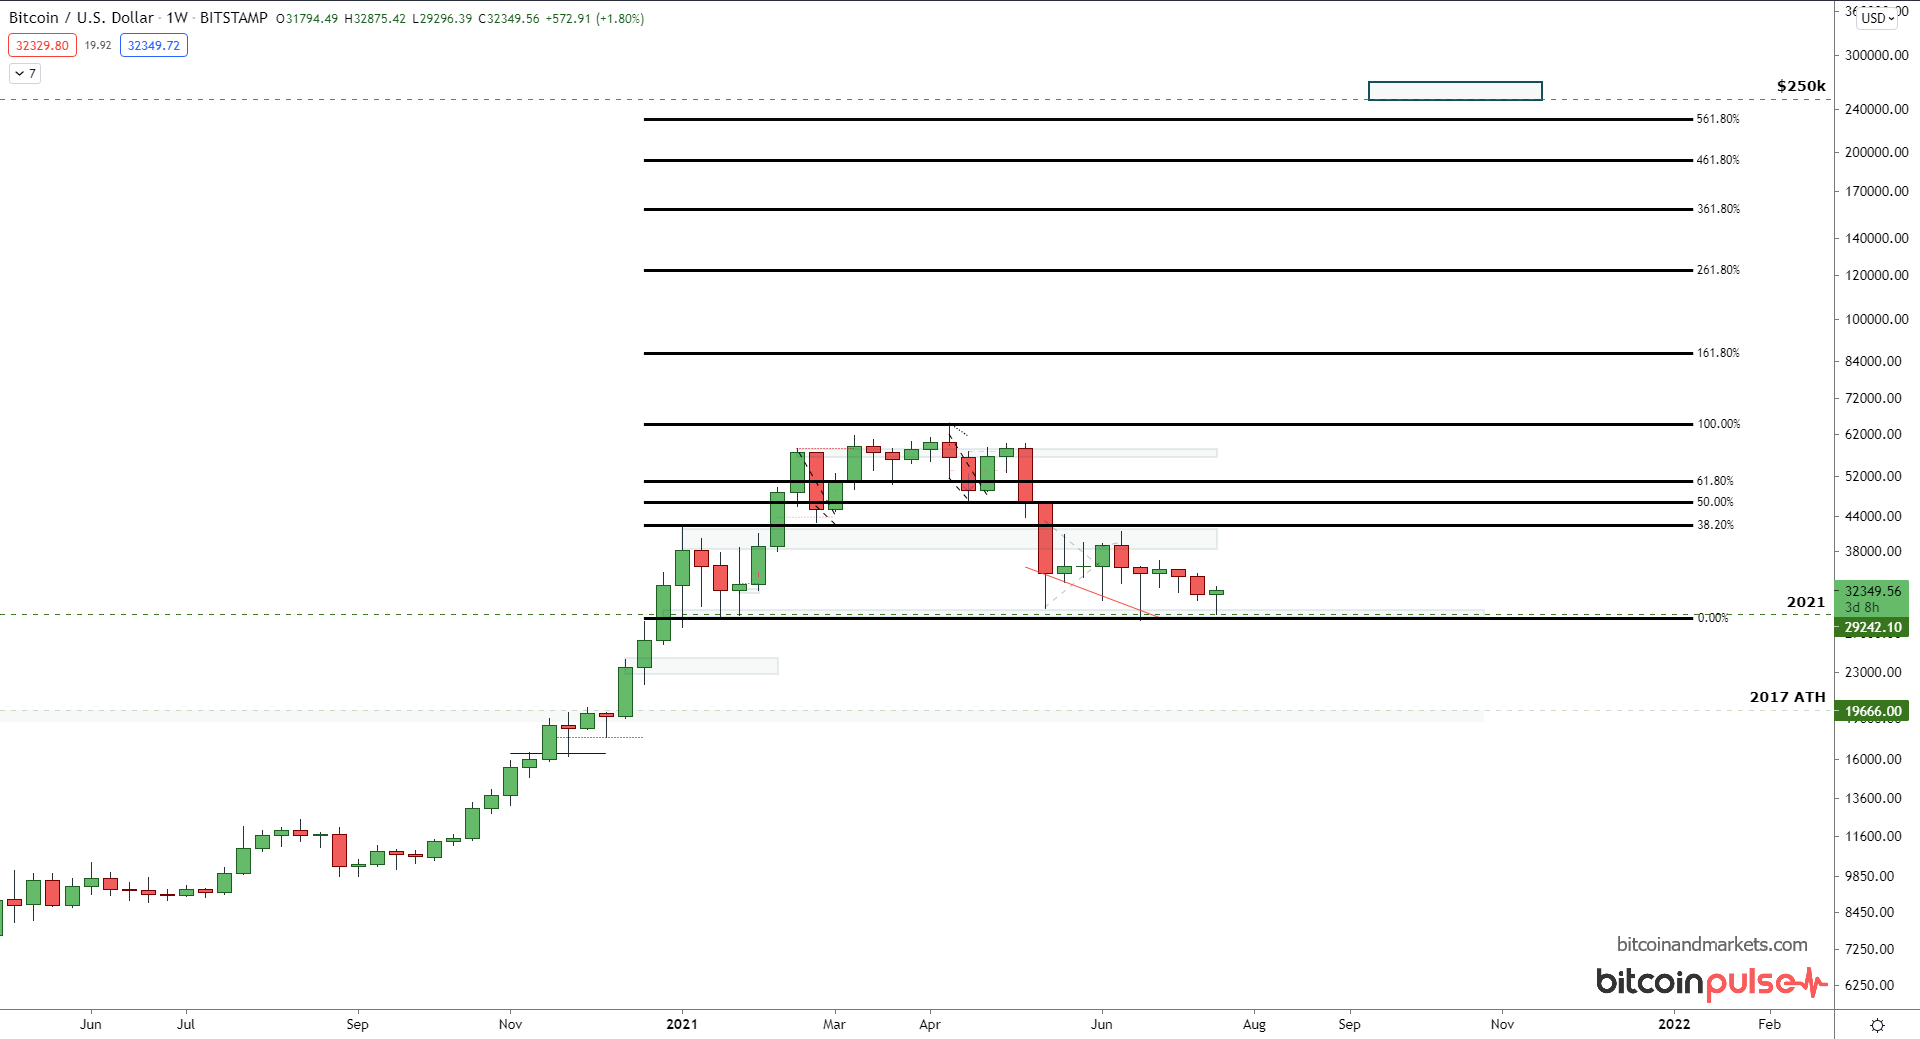
The second half of bull markets tend to end in a parabolic move. So, it is possible price consolidates in the $100k range, before a quick move to the target and a blow-off top.
Immediate price action
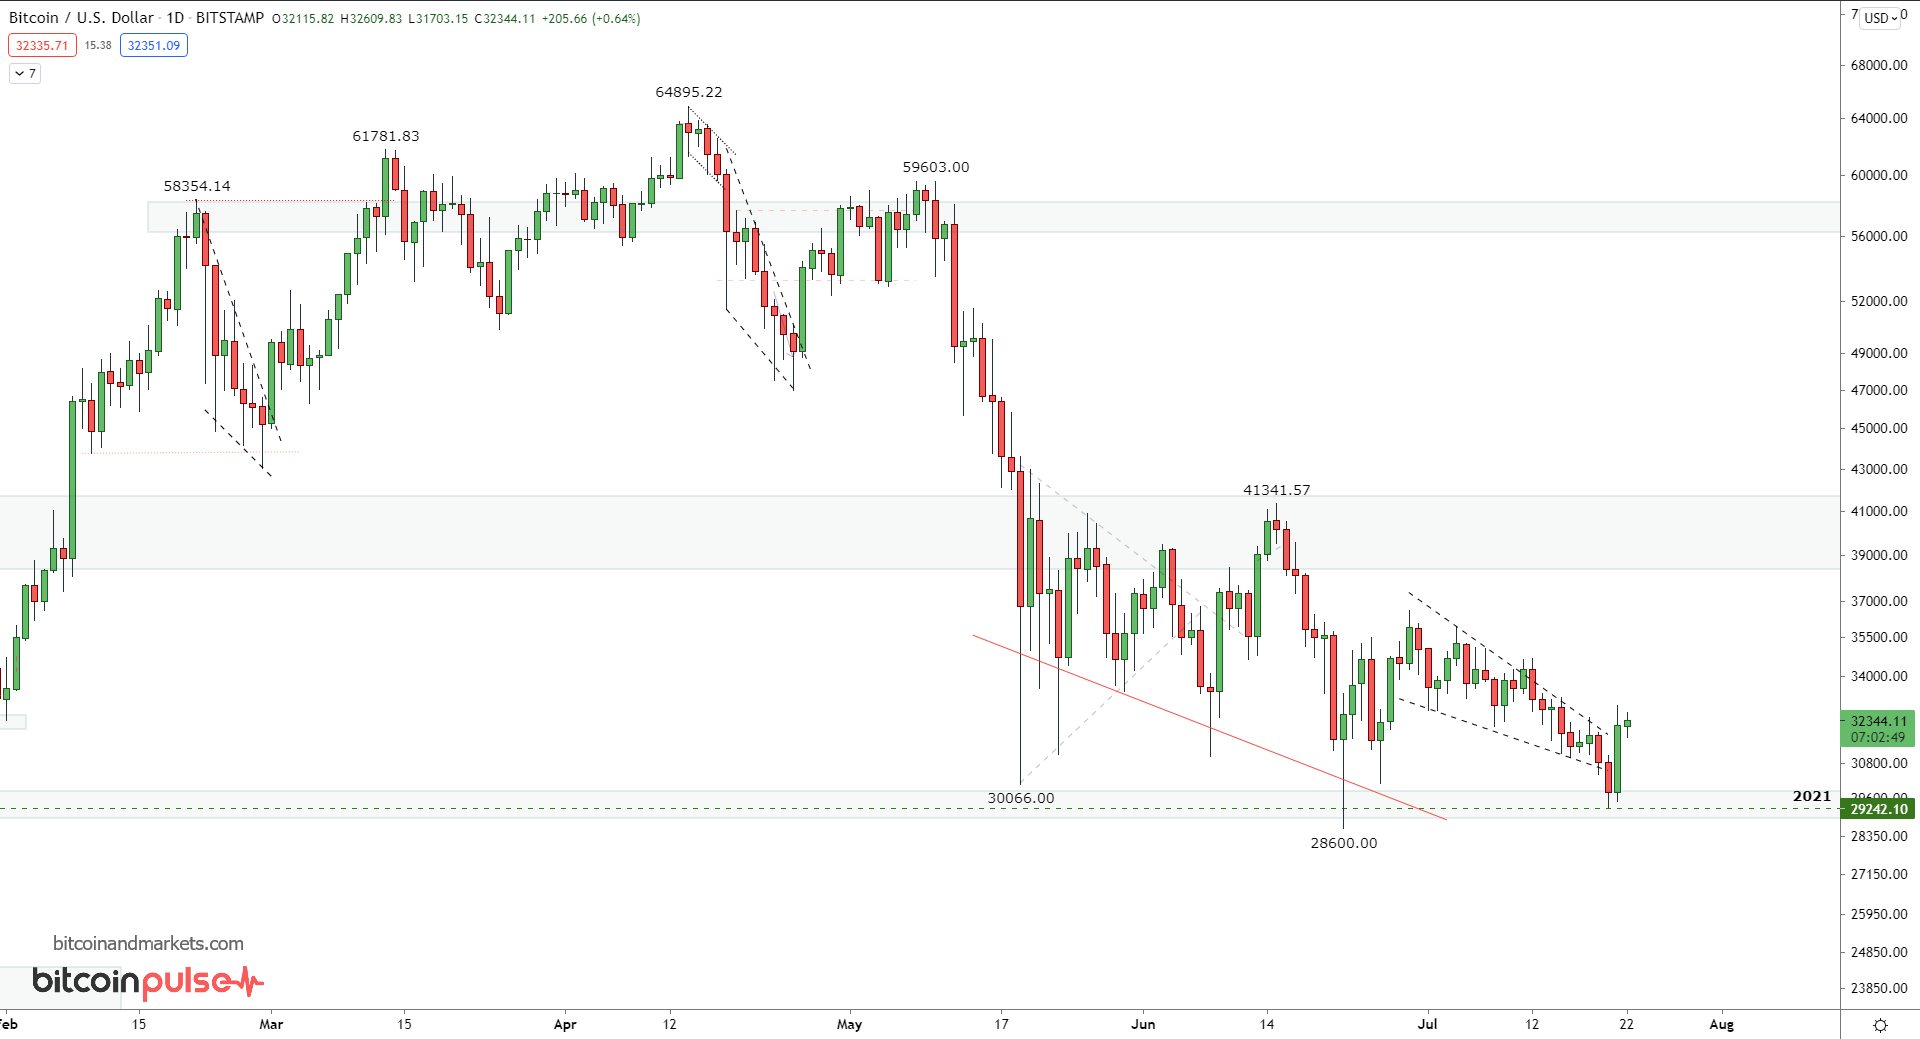
The daily appears to be picking a direction. It bounced almost perfectly off the 2021 open price, forming a higher low than mid-June and confirming heavy support.
There was the Jack Dorsey/Elon Musk chat yesterday where Elon once again said he owned bitcoin, Tesla owns bitcoin and SpaceX owns bitcoin. That put a slight bid under the price.
We must wait for more confirmation. To say for certain if that was the bottom.
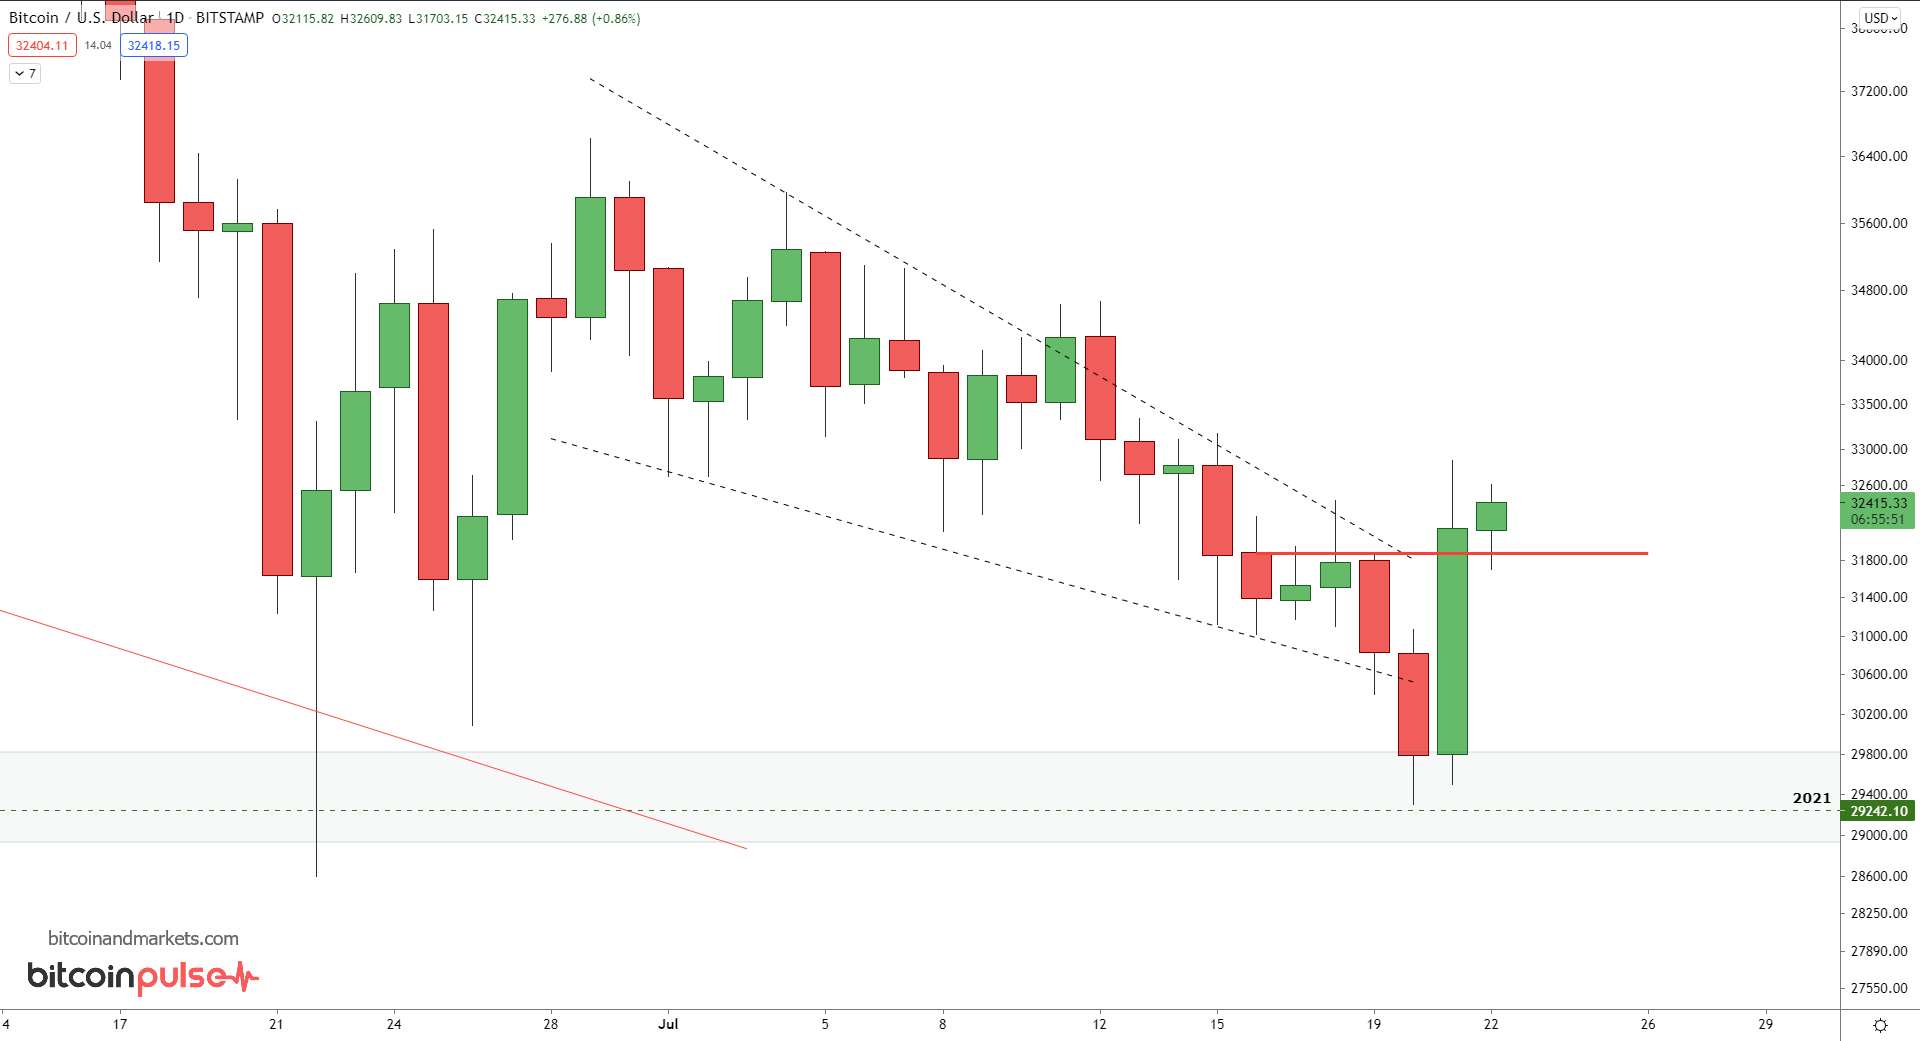
On the above chart, we can see that price is holding above recent daily opens and closes (red line). That is the line in the sand. If price closes on the daily below that level, I will have less confidence that this is the end of the downward price movement.
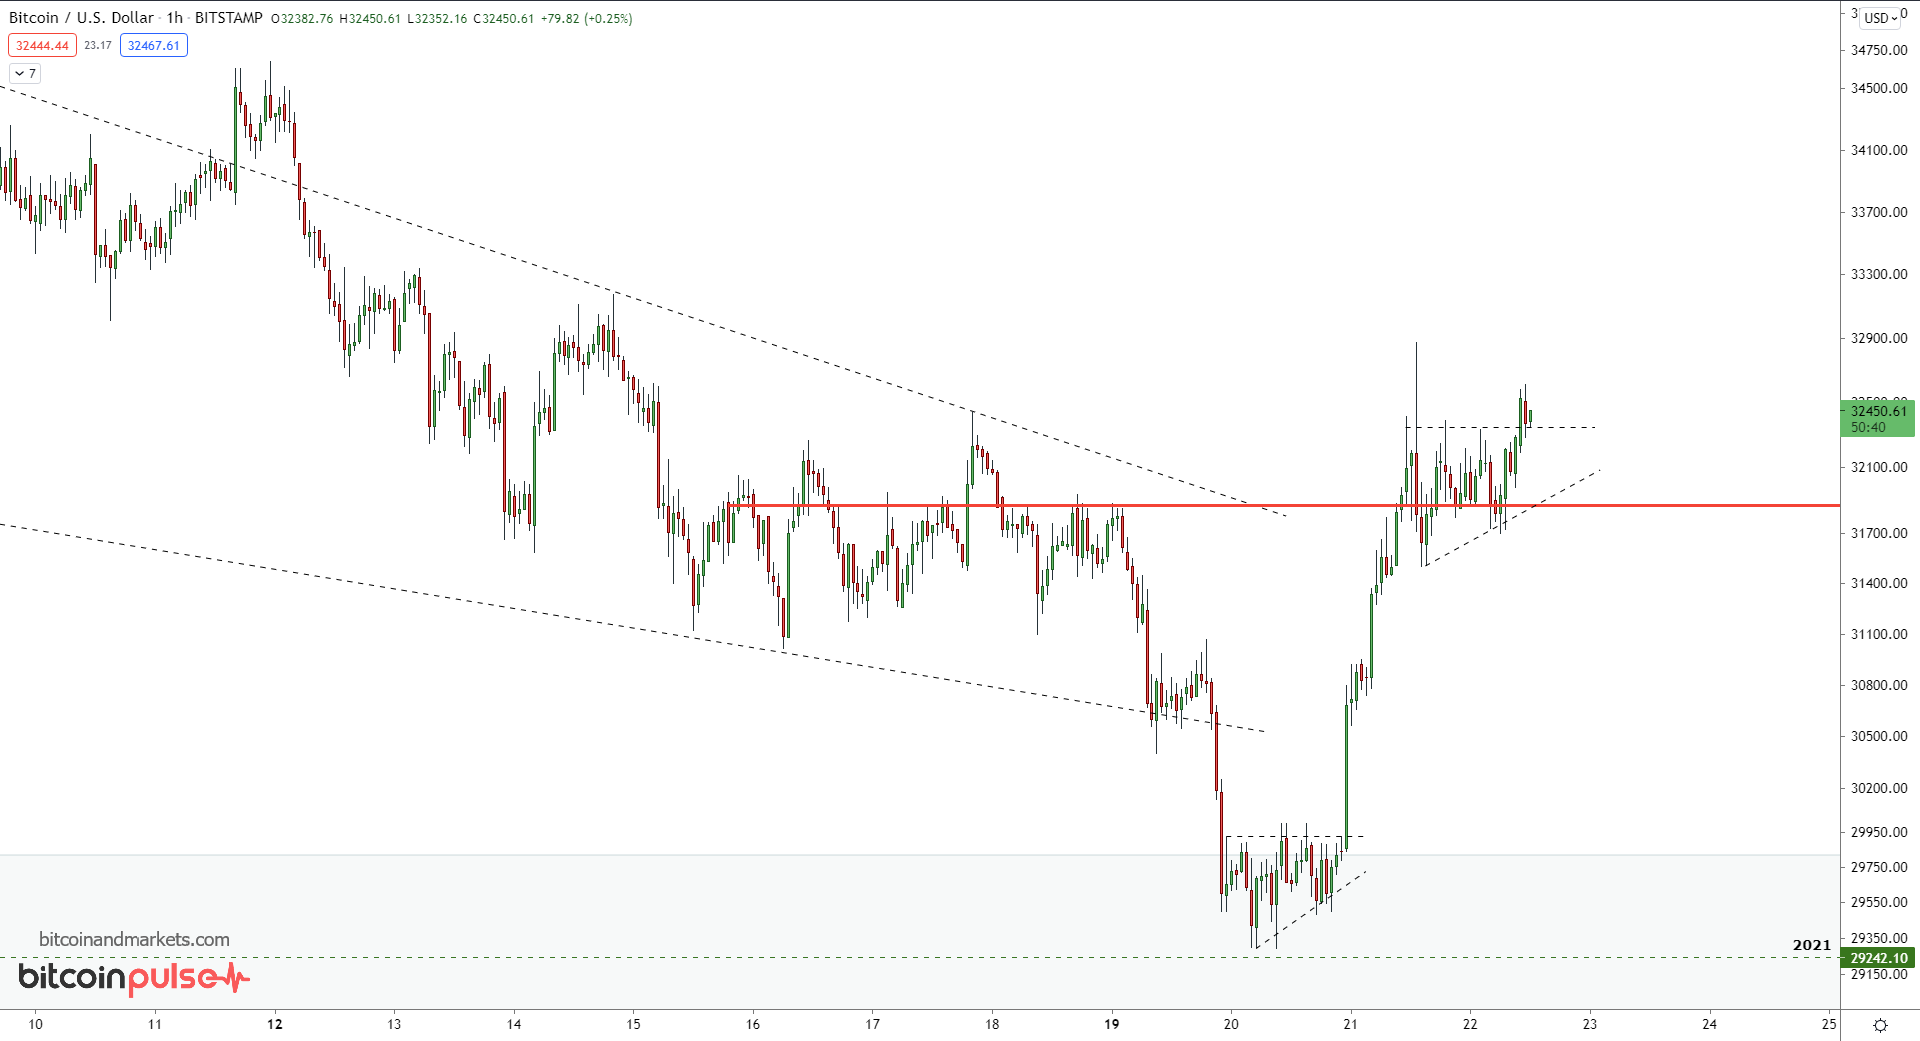
On the 1 hour chart, the movement off the bottom was impressive and the importance of that red line becomes apparent. If price slips back below candles of the last day and closes the daily below the red line, that could easily signal a return to the bottom. However, at the time of writing, price might be breaking out to new highs.
Overall
This mini-bear market has gone on long enough. Bullish currents are returning. We made it through the non-event of the GBTC unlock, and there are no significant unlocks left in the foreseeable future. There is growing chatter about a bitcoin ETF in the US, with Hester Pierce blasting her own agency, the SEC, for failing to act. And in general, market selling is exhausted. Few noobs with weak hands are left, and people continue to stack their sats weekly or monthly.
Last year this week, price was $9,200 and was when price really started to take off. It rallied 600% all the way to $64k. If the 3rd week of July this year is anything like last, we could be just starting the next move.
VITAL STATS
Takeaways
- Difficulty has stabilized
- Network traffic is low. Low transaction count, very low fees
- GBTC unlock did not even approach the silly projections of -25% discount
- General model oversold conditions, S2F, Mayer Multiple, etc.
- CME open interest has started climbing! This is a significant change!
- Dollar continues to strengthen
- The network and market is stable and improving marginally. This is a change from the past two months where everything seemed to get worse every week.
Want to see a specific metric I don't include? Let me know.
Pricing
| Market Cap | $0.608 trillion |
| Market cap (AU/oz) | 336.95 million troy ounces |
| Market cap (AU/tons) | 10,480 |
| Sats/$ | 3,085 |
| Finney (1/10,000 btc) | $3.24 |
| Miner Revenue per day | $28.6 mil |
Investment Indicators
| GBTC Premium | -11.1% (very low but steady) |
| Stock to Flow Multiple (10d) | 0.32 (LOW, buy zone) |
| Mayer Multiple | 0.72 (EXTREME buy zone) |
| ROI 3 mo | -36.7% |
| ROI 52 wk | 246% |
CME Futures
| Front Month Expiry | 30 July 2021 |
| Total Open Interest | 7,956 (+900 from last issue, low but growing) |
Network
| Network volume 24h | 1.68 million btc (low normal) |
| Est. Difficulty adjustment | +2% in 9 days |
| Difficulty Last 3 Avg | -12.7% |
| Avg block size (daily) | 1.09 MB (85% full) |
| Avg transaction $ value | $60,682 (1.87 btc) (low) |
| Median trx value | $767.96 (0.024 btc) (low avg) |
| Avg $ fee/transaction | $1.91 (0.59 finneys, 12 sats/b) (low) |
| Median fee | <$0.25 (0.05 finneys) (very low) |
Stablecoin dominance
| Tether dominance (vs all altcoins) | 8.79% |
| Stablecoin dominance | 16.25% |
| Stablecoin/bitcoin | 18.94% |
Top Forex Crosses
| DXY | 92.92 |
| EURUSD | 1.1759 |
| USDCNY | 6.4699 |
| Gold/USD | $1,805 |
| Silver/USD | $25.31 |
Where else to find me : Fed Watch podcast | BTCM Research blog
The Bitcoin Dictionary is LIVE on Amazon!
Thanks!
A