Macro Chart Rundown - 12 Aug 2021
In this post we look at charts of #Bitcoin, #Gold, #Dollar, and #Oil and draw valuable conclusions based on our macro thesis.

If you like this content, SUBSCIBE and SHARE! Thank you.
Below you'll find analysis on
- Bitcoin
- Gold
- Dollar
- Oil
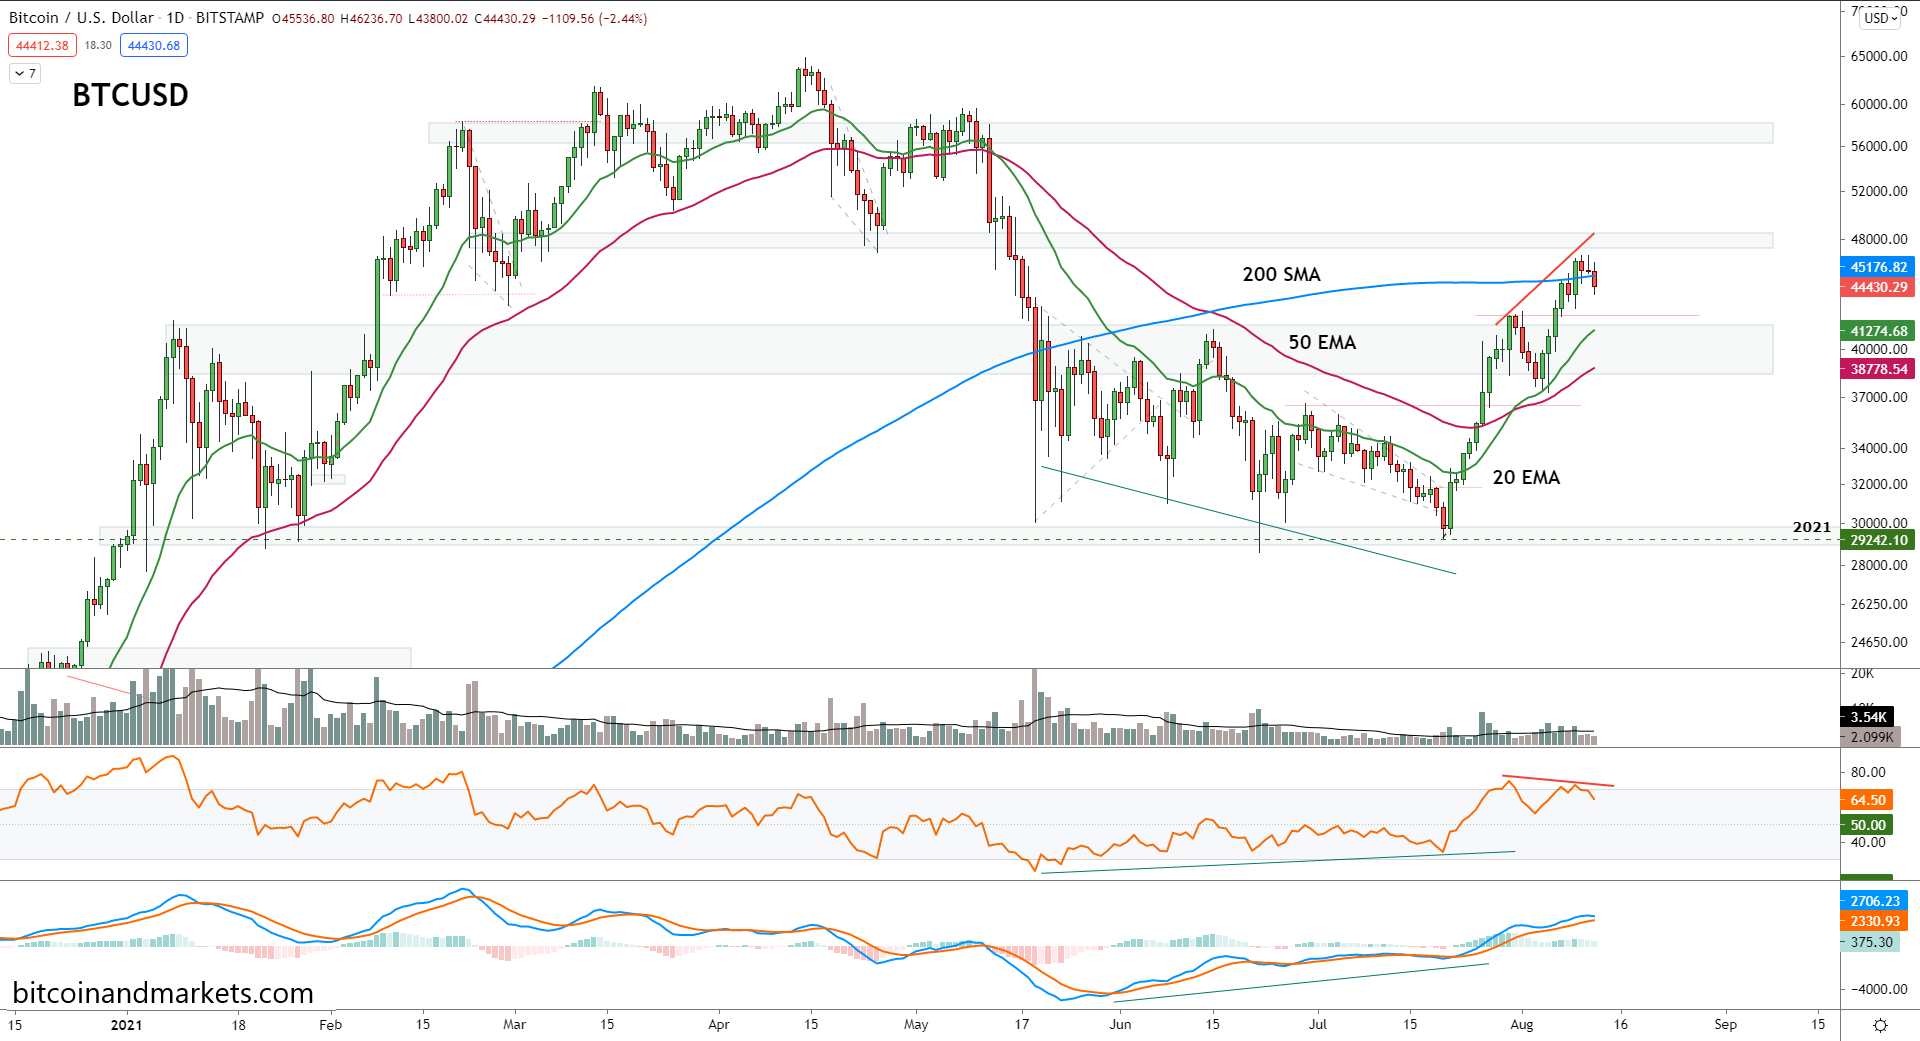
Bitcoin
I wrote about bitcoin yesterday exclusively for members, so I won't rehash everything here. This content is reader sponsored, I've never taken a sat from altcoin promoters or special interests in the space. My opinions are pure and uncensored, which is rare in this space. I give out several posts a week of insightful bitcoin and macro content, and offer some highly detailed bitcoin analysis for paying members with roughly a dozen charts each issue.
Anyway, to sum up my bitcoin take, with a few quotes from yesterday:
Several technical indicators are providing resistance in the area of the chart where we find ourselves. [...] It is possible price slows down for a couple days here, but all signs are pointing to a continuation toward higher prices.
... Breaking through the top of the cloud has typically provided several days to a week of resistance, unless it is broken in one big green daily candle. Since that didn't happen here, the cloud is telling me it will take up to a week to breakthrough.
... Despite that, we must respect the RSI at this point and perhaps take some profits off the table.
Price did slow today, making its way down to the next closest support of $42k. I expect that level to hold and to have another push higher this month.
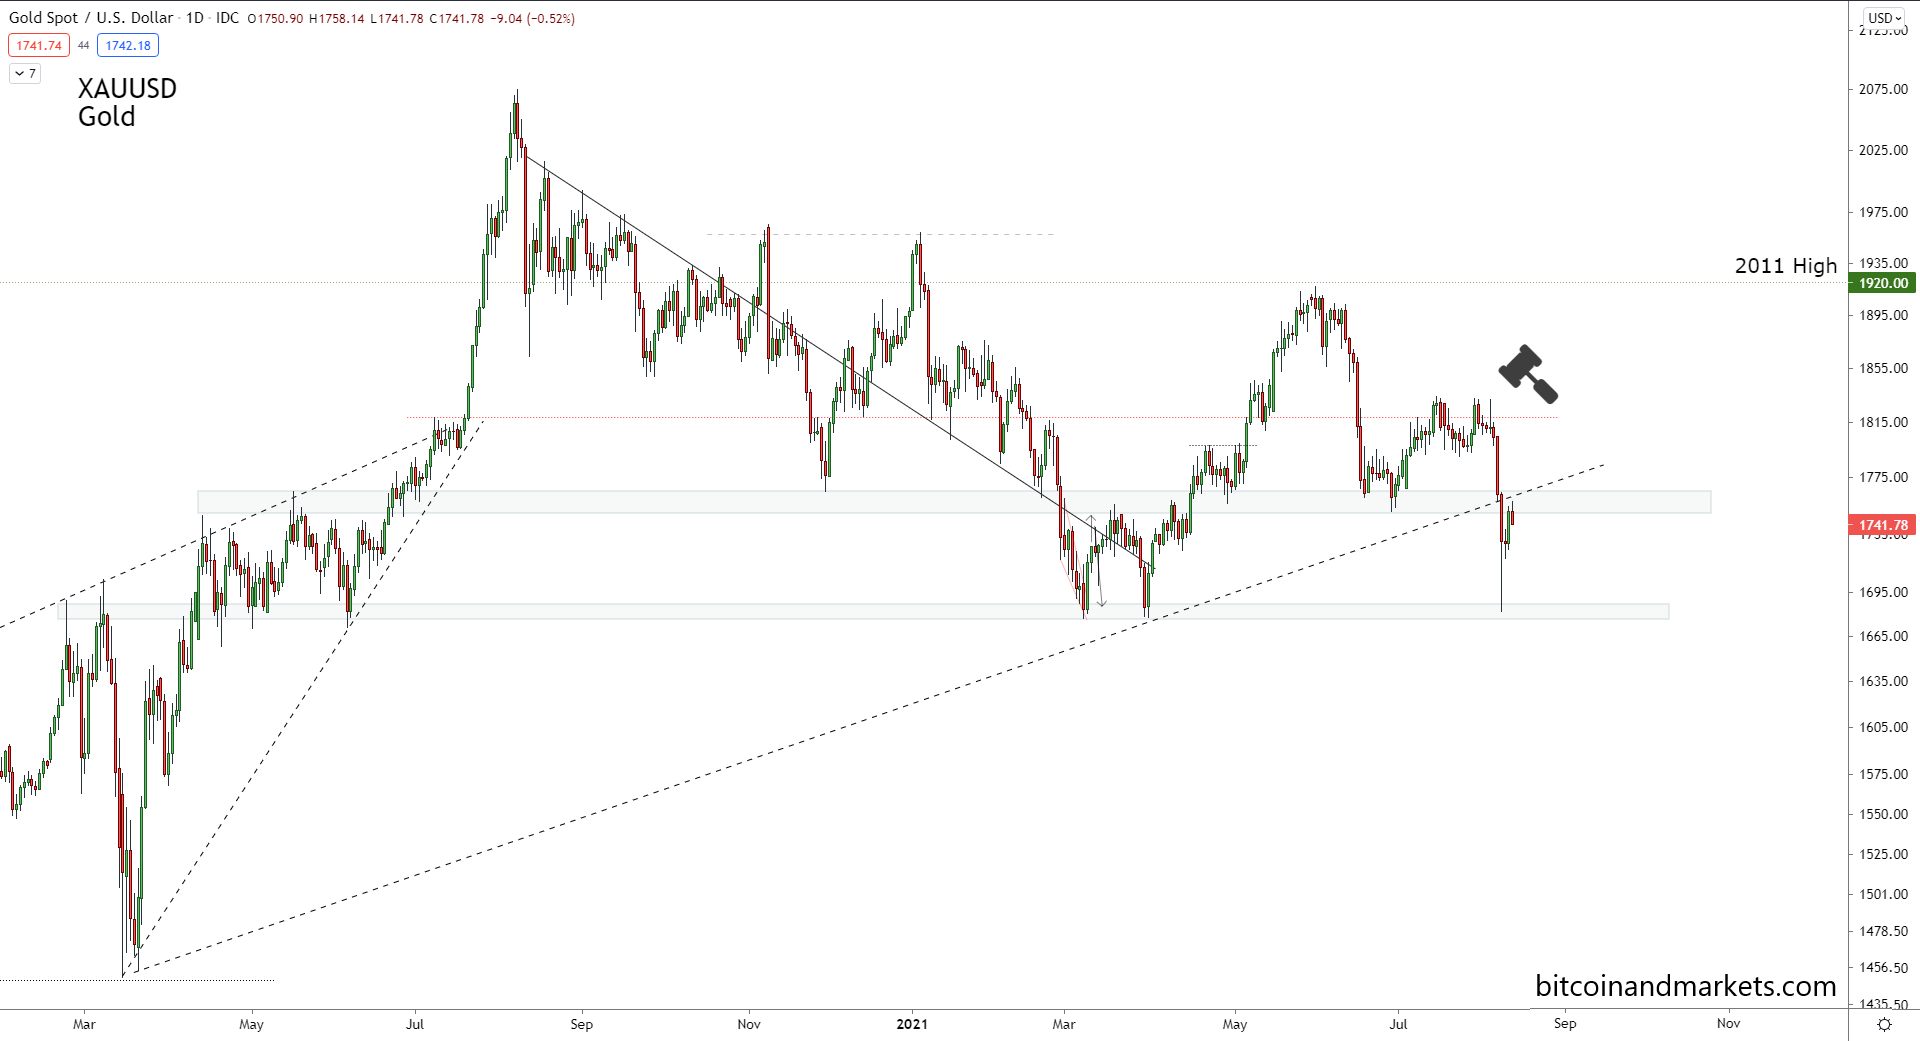
Gold
Gold was absolutely monkey hammered Friday and Monday this past week. I can't lie, this chart looks horrible for a gold bull. If this were a bitcoin chart, the nice bounce over the last few days would be a positive sign, but not for gold. It doesn't have these kind of two day slams often, and when it does, they typically lead to more downside (March 2020 would be the exception).
Price has moved below the diagonal trend line and the horizontal support now resistance. If gold manages to inch above this level into the $1780-1790 range, there is a possibility it can continue climbing from there. But gold is not explosive like bitcoin, it will struggle to make 10% gains.
The weekly chart looks a bit better, and by that I mean more neutral than bearish. I'll include the oscillators on this one. The weekly candle is forming a very long hammer, meaning the bulls are trying to push back. But the bounce is stalled at previous support turned resistance. The RSI never reached 70 on the last rally, which signals weakness, and now is dangling without any momentum. It could reverse, but, again, basically neutral. MACD never did shake the bearish turn, but also could reverse at this point, but that's unlikely.
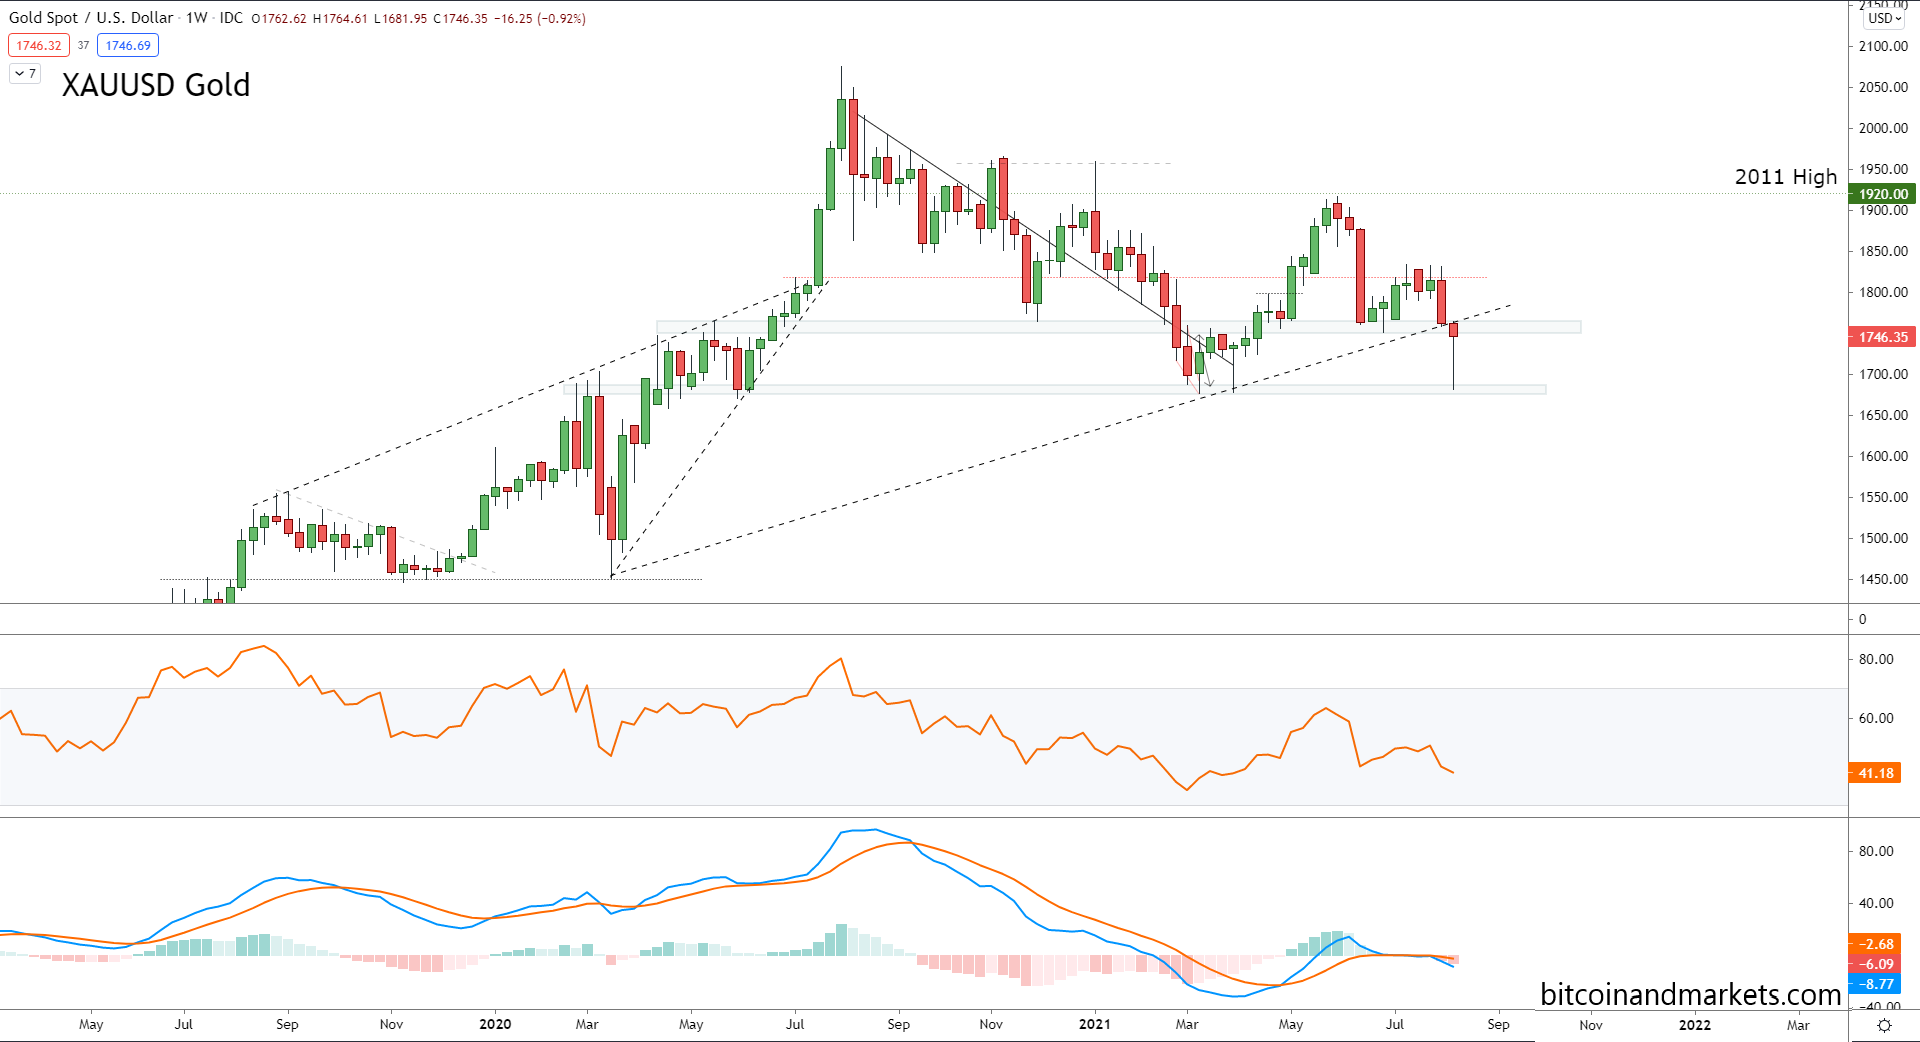
Taking a look at the gold TD sequential, it doesn't look pretty. This price drop will likely continue until a red 9. That means 7 more weeks at least of the down trend. We do see a situation where the TD count only hit a red 2 before bouncing back in March 2020, but at that time gold was in the middle of a bullish rally. Right now, gold is trying to find its footing, a completely different background scenario.
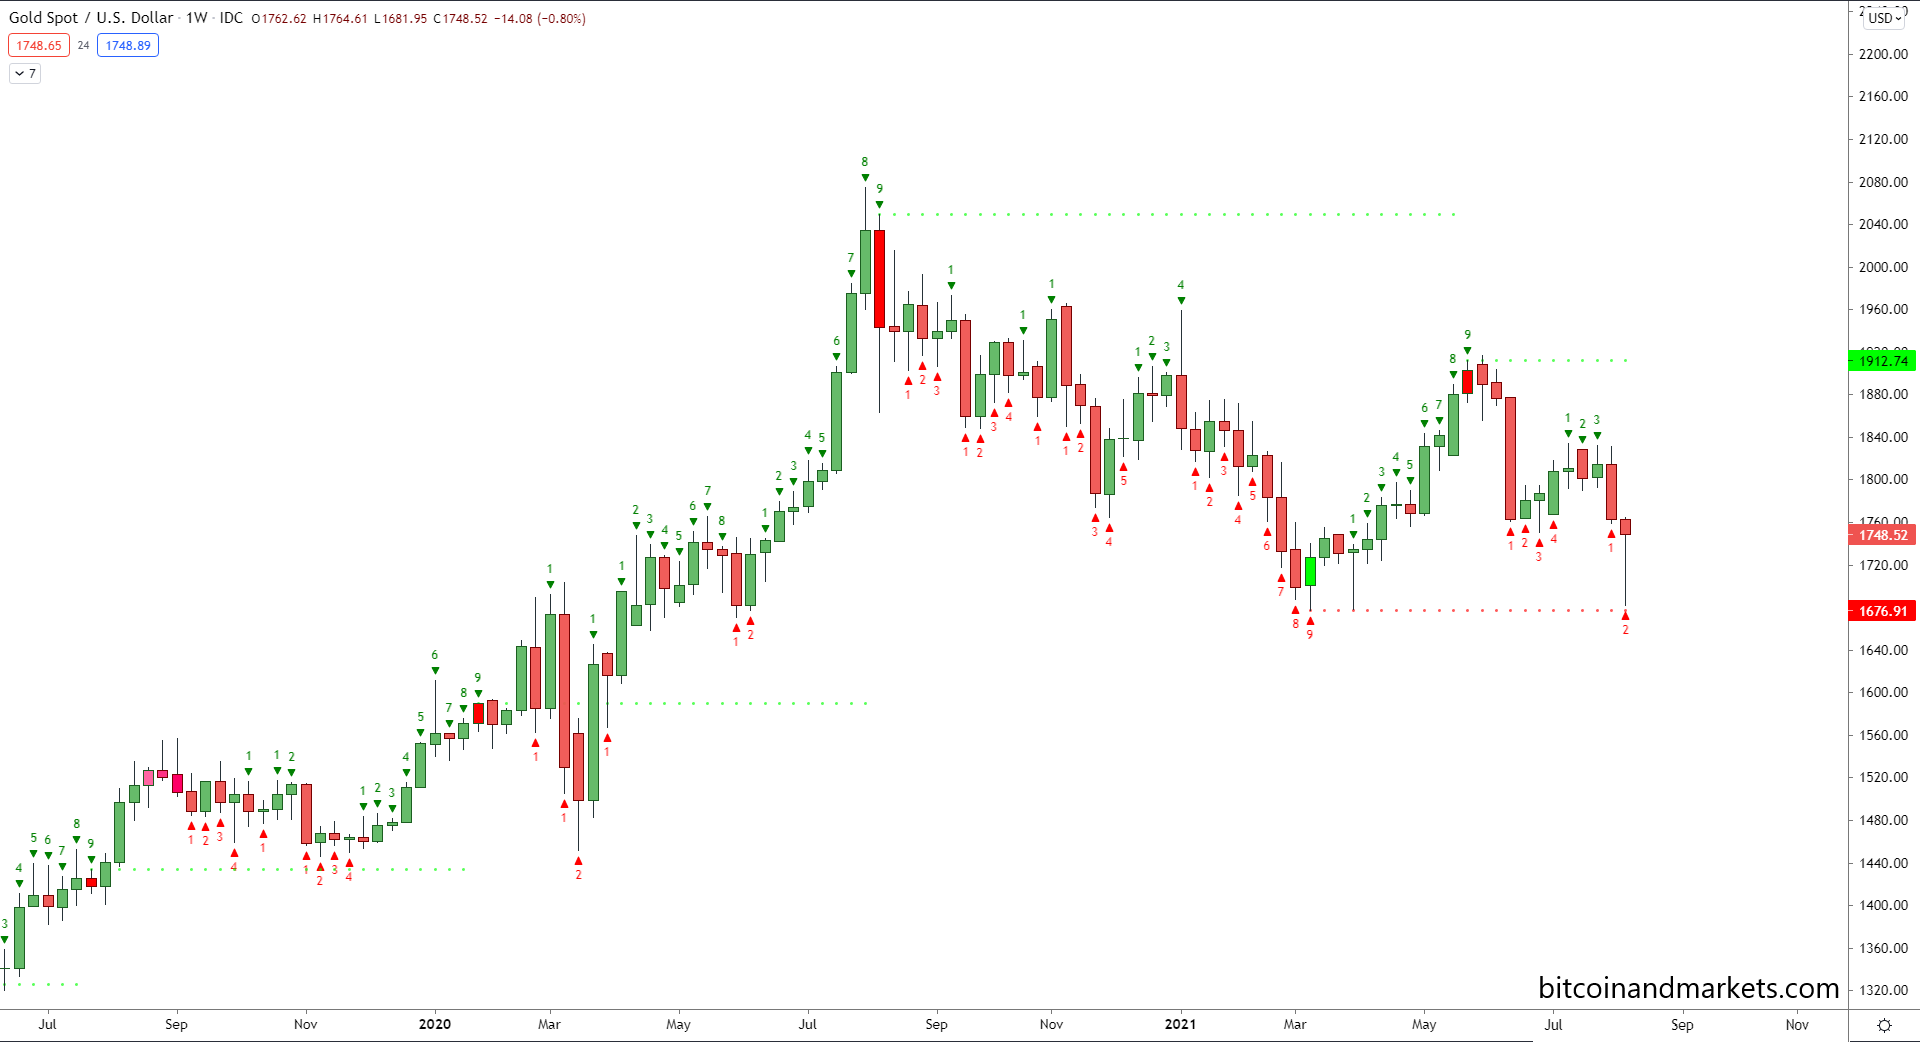
Gold should still get some support from a strengthening dollar, counterintuitively as pointed out in the last Macro Chart update. I do not think it will drop below $1500, but reaching out for that level looks likely right now. One thing is for certain, this price action from gold is, in my opinion, 100% proof positive that we are not headed for runaway inflation, or even high inflation.
Dollar
Sometimes I feel like a broken record. People continue to scream and warn about inflation, and I keep saying the end of this fiat era is deflation. The dollar will strengthen as the rest of the world struggles more than the US, making them rush for the safety the global reserve currency (and bitcoin).
But let's stay focused on the charts. The bottoming pattern in the dollar remains intact and strong. It's pressing upward looking about ready to pop.
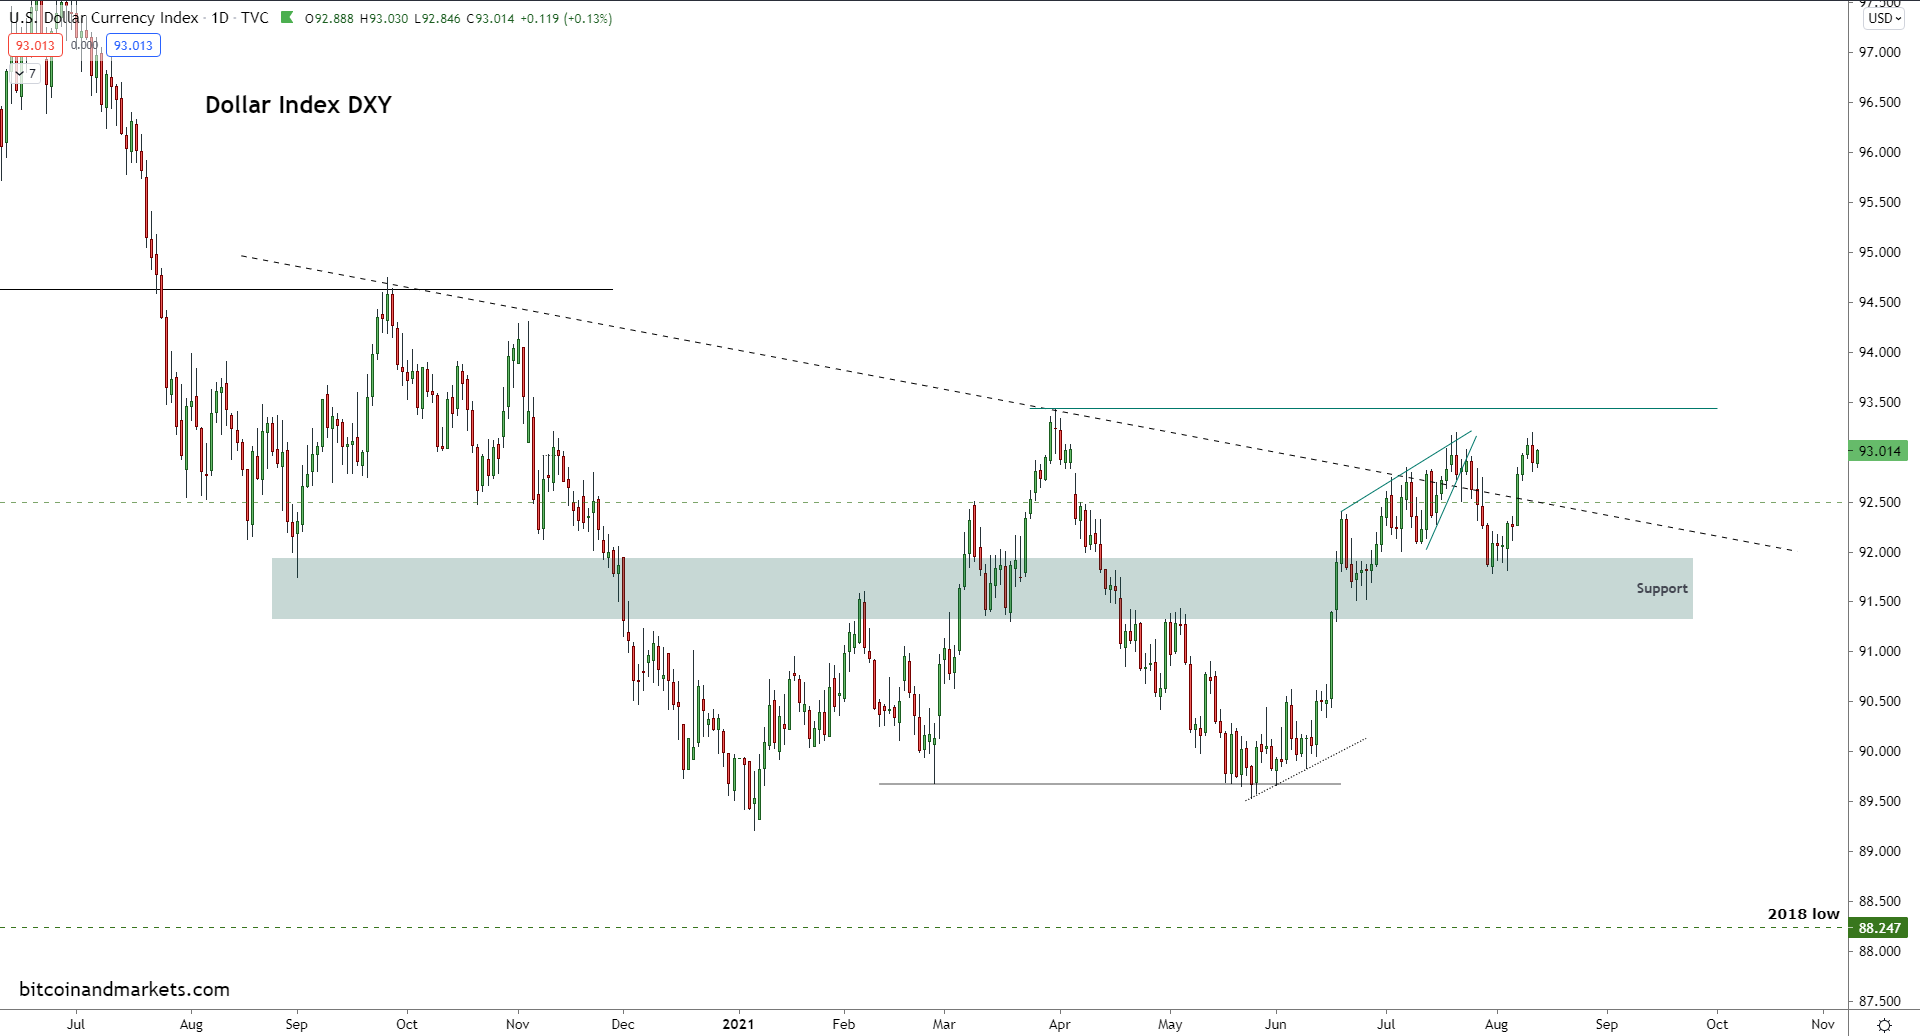
The Fed is starting to make some clever moves with the standing repo facility offering 0.25%, that will open for business on 1 Oct. This move will relieve pressure on foreigners' scramble for dollars in times of crisis, so might slow a dollar rise. Putting on the geopolitical hat for a second, that will in turn add stress to smaller emerging markets which don't necessarily have access to the Fed facility (the minimum is $5 billion). Therefore, I expect the next crisis to be imminent in smaller economies.
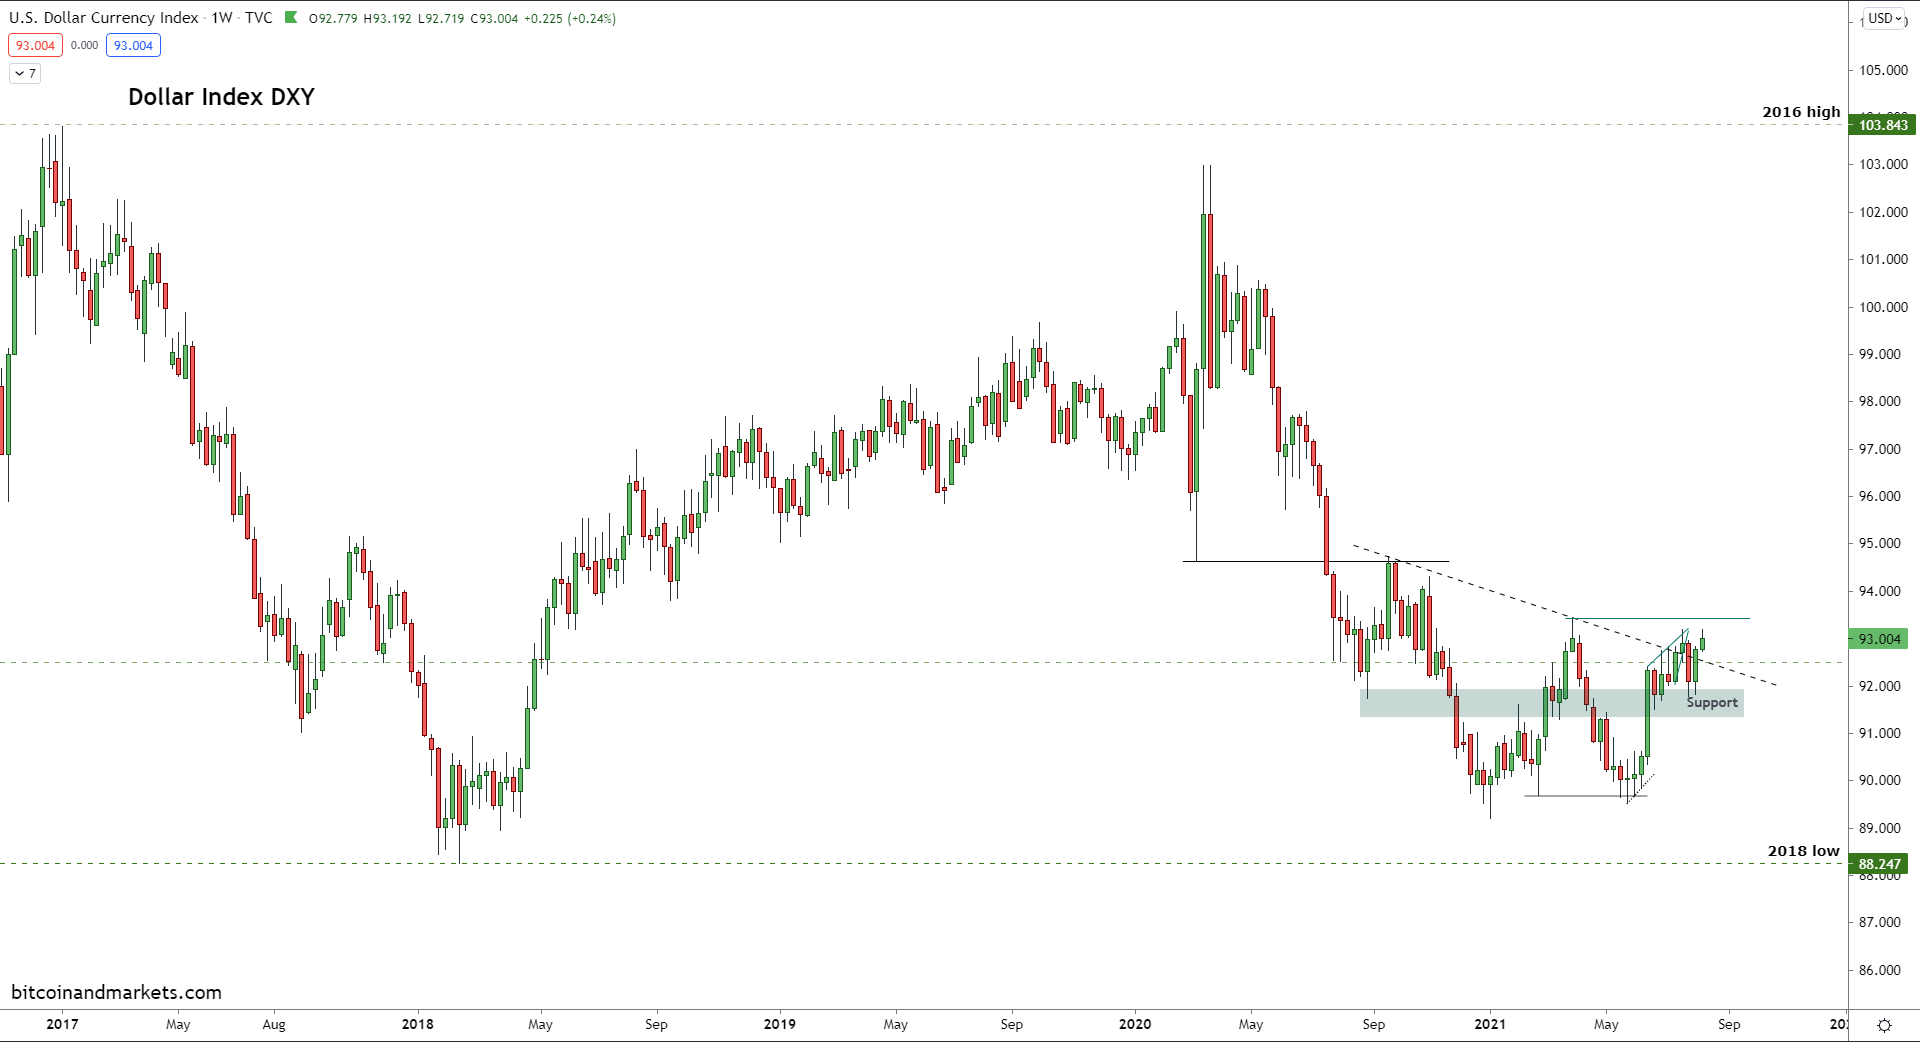
Back to the charts... You can see in the weekly chart why people are concerned that the dollar is about to partake in some sourced earth policy.
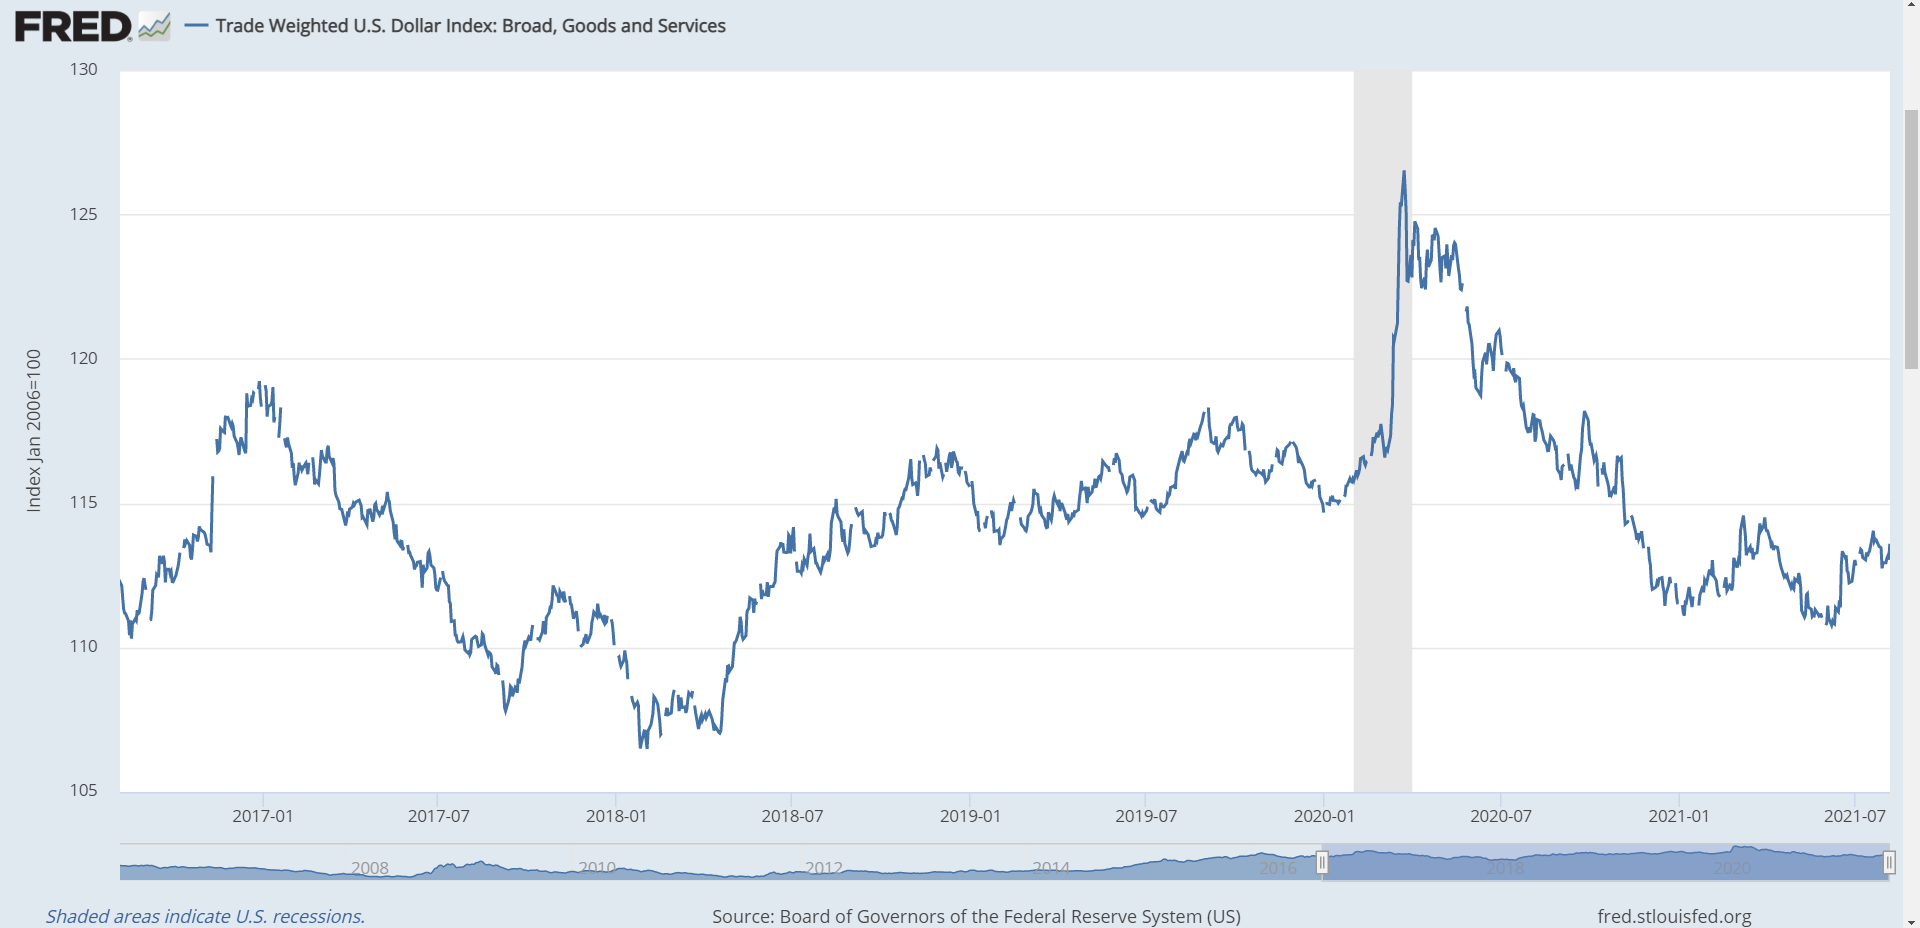
The trade-weighted dollar also shows the bottom pattern and looks like it wants to break out higher.
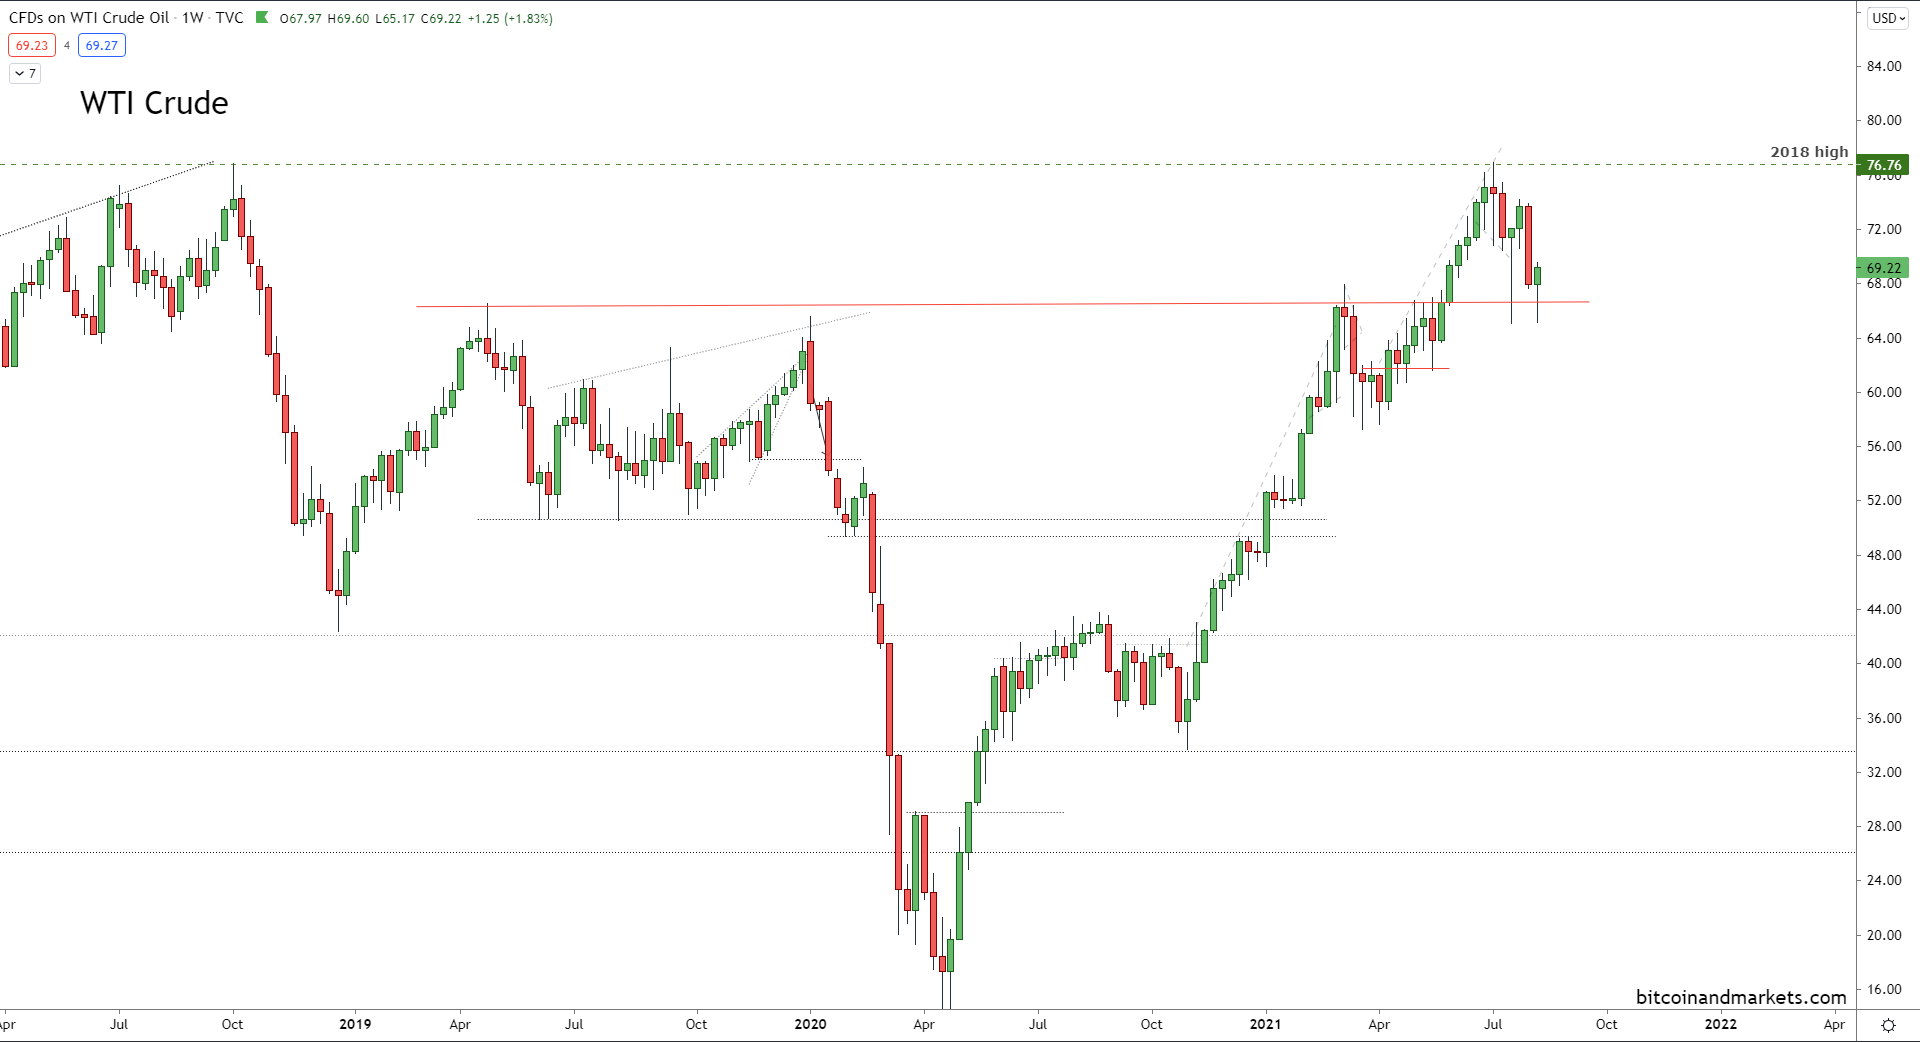
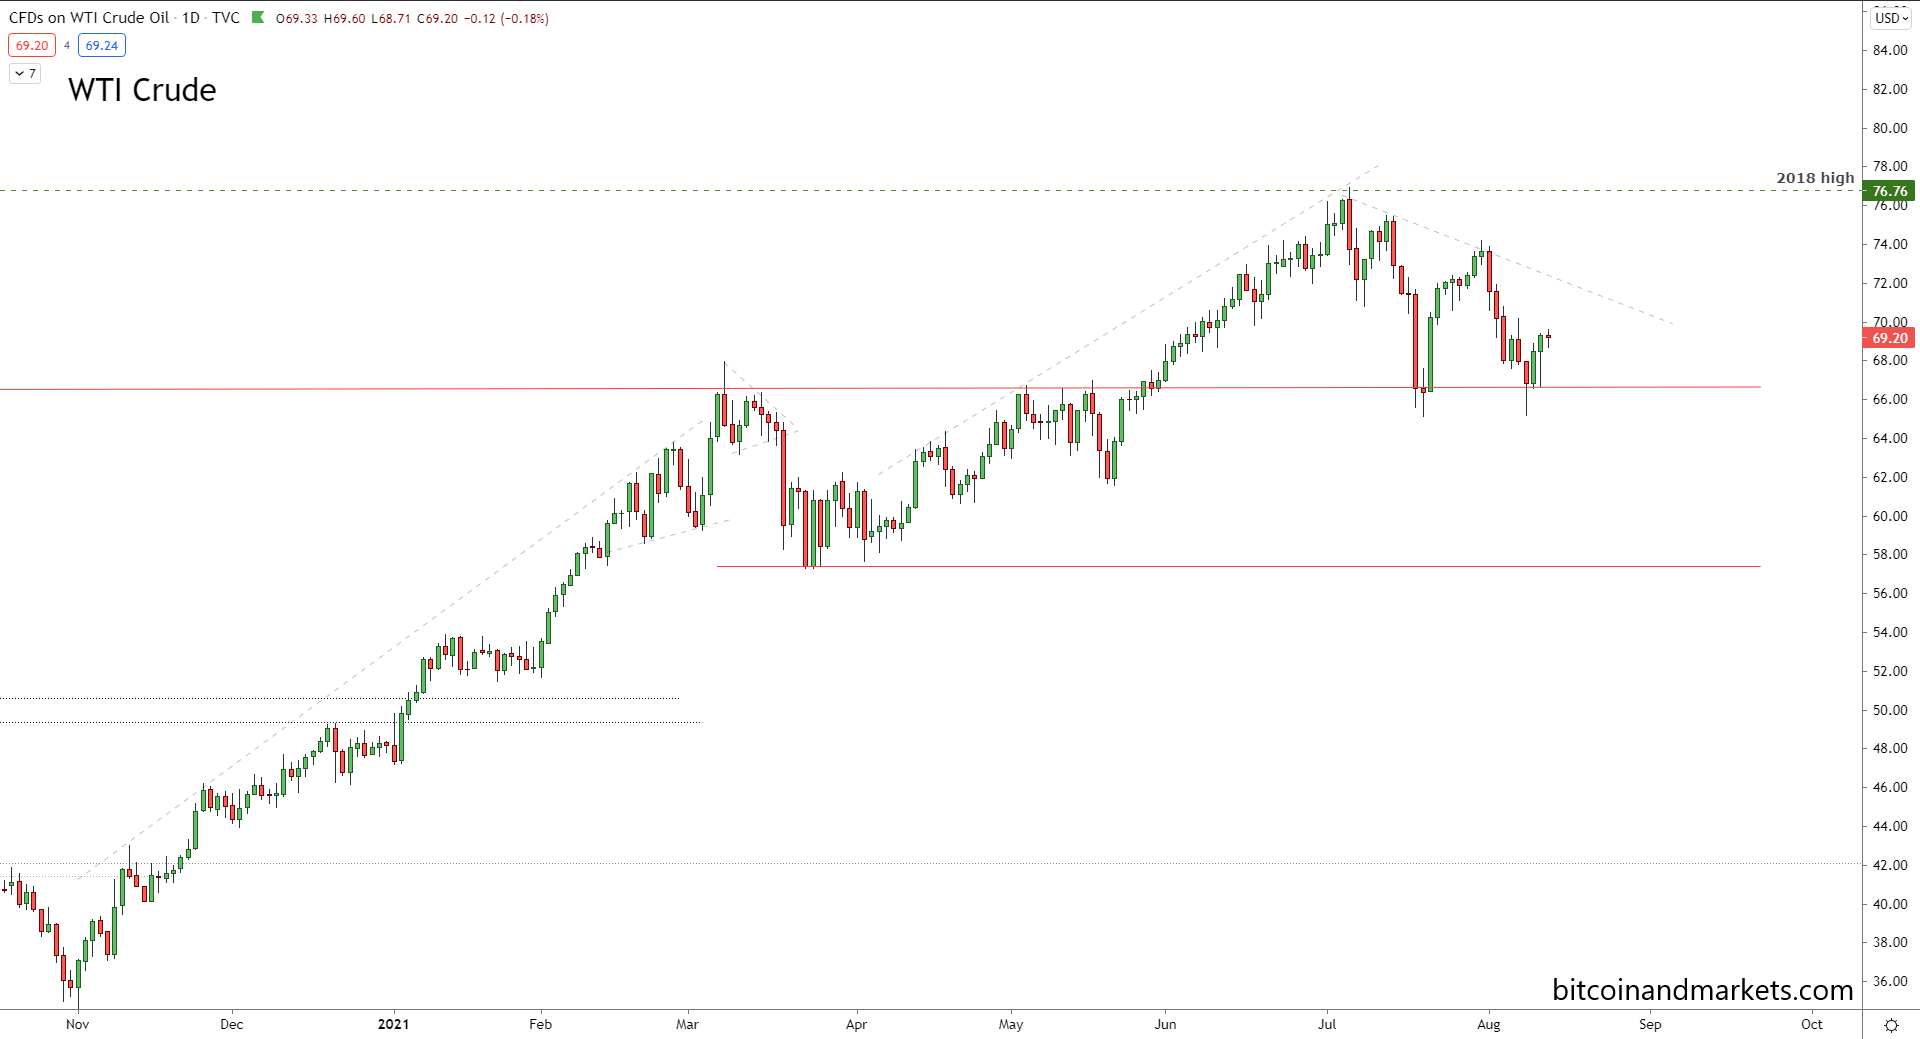
Oil
Oil is sideways on the week. It has now double tapped the $65 handle and is not making a strong statement for the bulls here. The first oil chart is the weekly, showing that price only barely reached the high from 2018, and is looking for support on the 2019 highs. Oil has moved a long way in the last year, but if you zoom out on this weekly chart, oil is far below where it was for almost the entire previous decade.
This chart is very similar to all other commodity charts right now. Everywhere we see topping and a reevaluation of the recovery narrative.
On the daily chart we can see this recent bounce on $65 has been weak. If this support level breaks price will quickly move to $57 or lower. Long term, oil should tend lower because global economic activity is weakening, cars are more and more turning to "external combustion" (funny term for electric cars which rely on powerplants), and the US is easily energy independent.
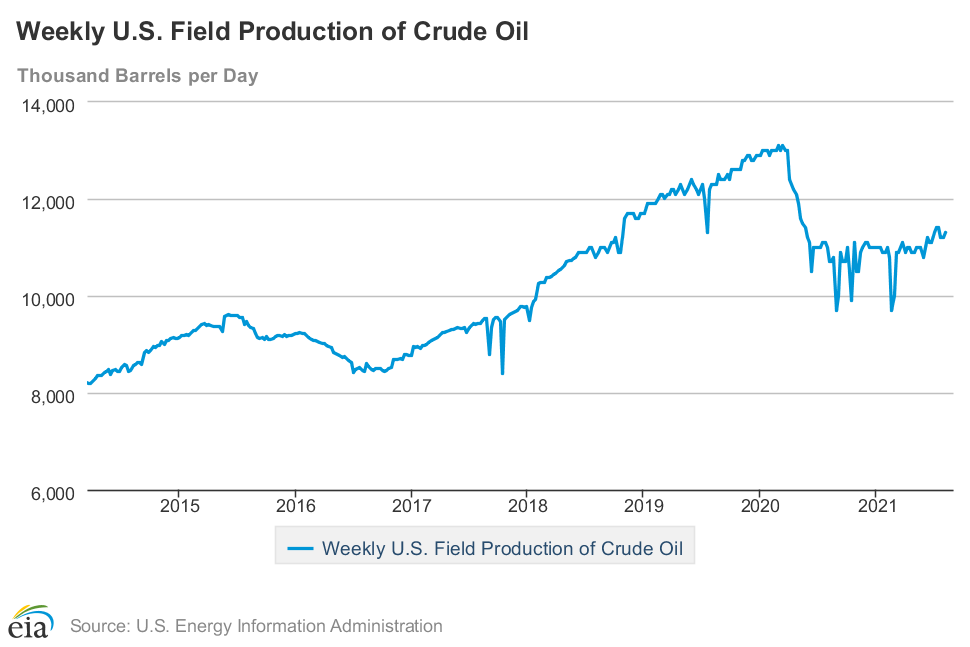
The US oil production numbers are slightly up this week, from 11.2 mil bbl/day to 11.3.
Conclusion
To summarize this update, we have bitcoin looking like it is taking a break for a few days, gold bouncing into resistance after an epic monkey hammer, the dollar just starting to break out of its bottoming pattern, and oil steady to lower on slowing economic activity and rising production.
All of this activity is pointing to a failure of the recovery and inflation narrative. After truly gigantic amounts of QE and stimulus, not just in the US but globally, all we get is 6 months or so of reflation? The underlying trend of deflationary pressure and stagnation continues.
Last comment for today... Do not forget that inflation and deflation are specific things - they are increases or decreases in the money supply. If supply chains break down and shortages cause prices to rise, that is not a monetary effect. Imagine blaming Fed "printing" for that scenario! We will likely hear lots of chatter about price increases due to the China slowdown, but that is not really inflation. It is very likely going to be massively deflationary, because Chinese companies and their global partners will struggle to pay their debts. Defaulting on debts actually shrinks the money supply.