Macro Chart Rundown - 22 Aug 2021
In this post we examine the Dollar, Inflation, Emerging markets, Oil, Gold, Inflation expectations and Treasury rates.

If you like this content, SUBSCIBE and SHARE! Thank you. Support by becoming a paid member or subscribing for the free weekly updates.
In this post:
- Dollar
- Inflation
- Emerging markets
- Oil
- Gold
- Inflation expectations
- Treasury rates
Dollar and DXY
(View online to see embedded tweets.)
On August 17th, I posted this to Twitter. It shows an inverted DXY chart breaking a critical level after failing to reach prior peak. Seeing it inverted in this way helps to break the viewer's bias.
What happens next? pic.twitter.com/iLI4D8bgUP
— Ansel Lindner (@AnselLindner) August 17, 2021
At that moment the DXY was passing 93.20. By last Friday it had spiked to 93.72, breaking cleanly above the March 31 swing high. The next areas of resistance are 94.5 and 96.0.
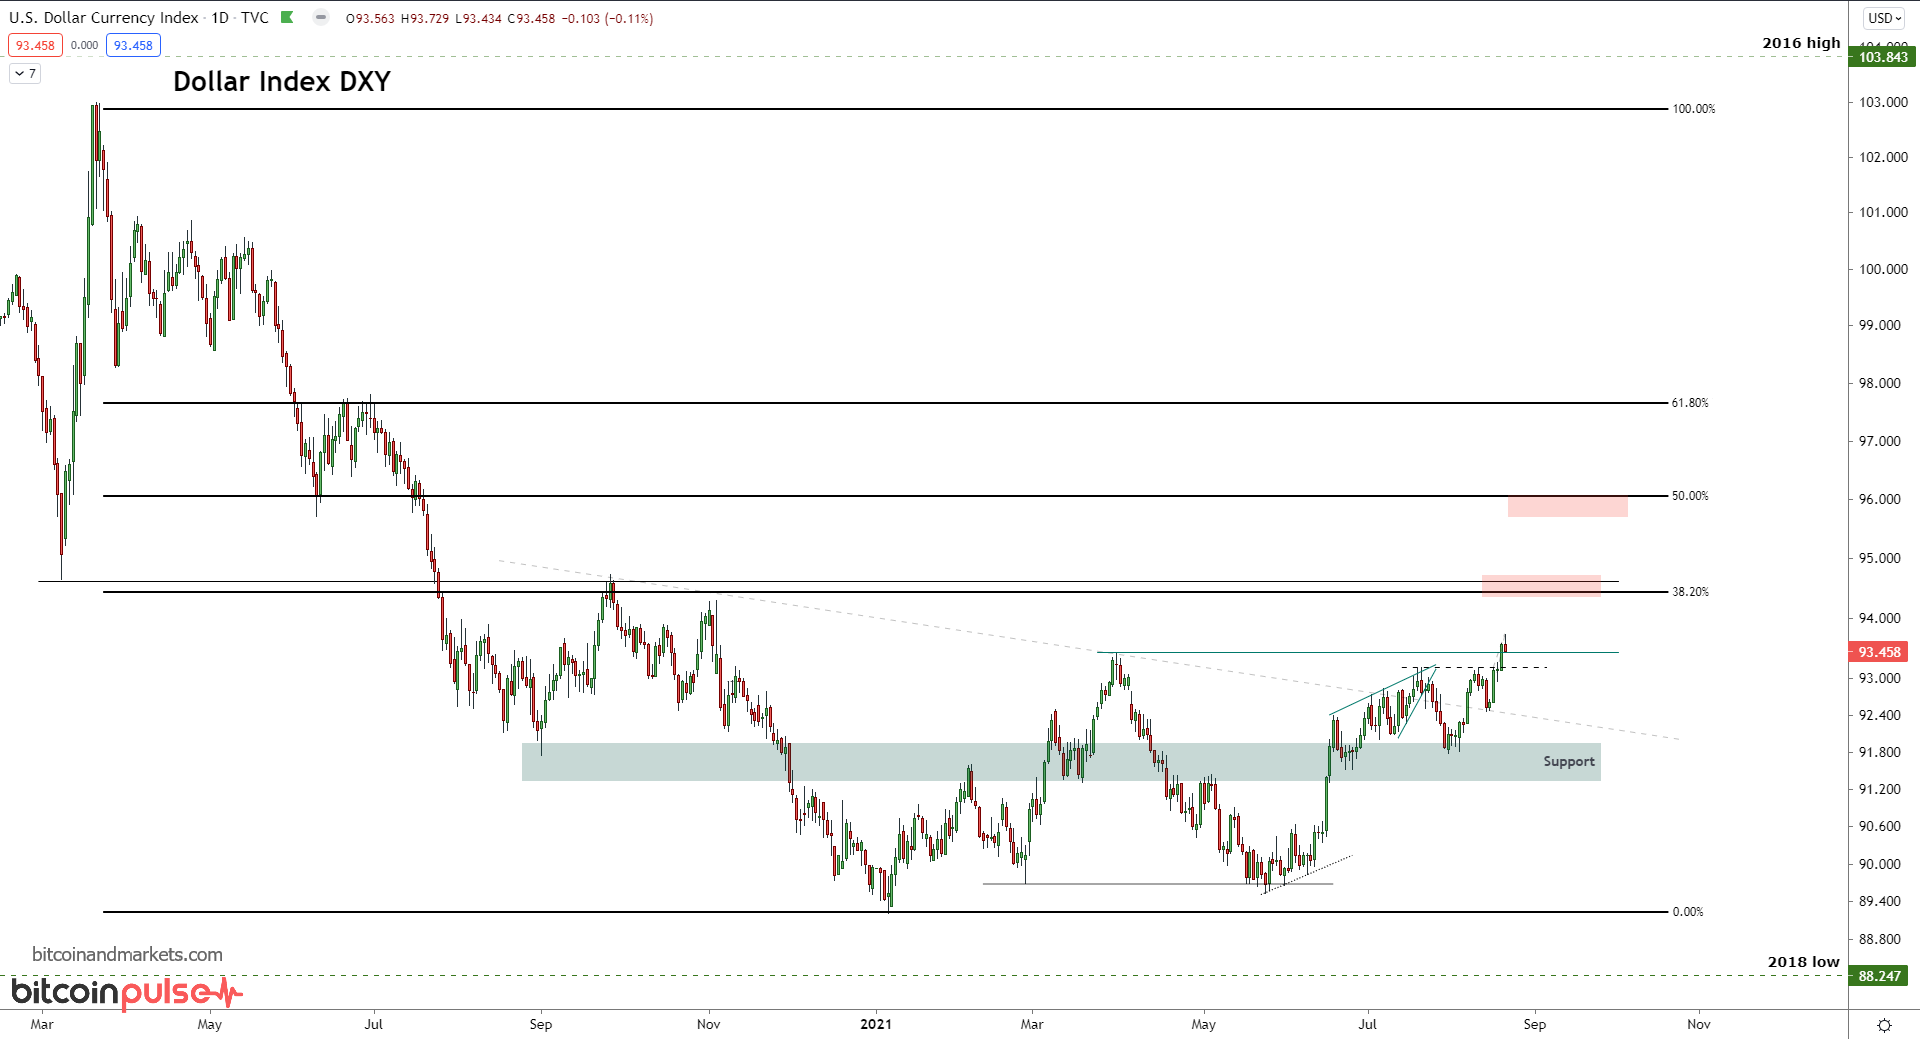
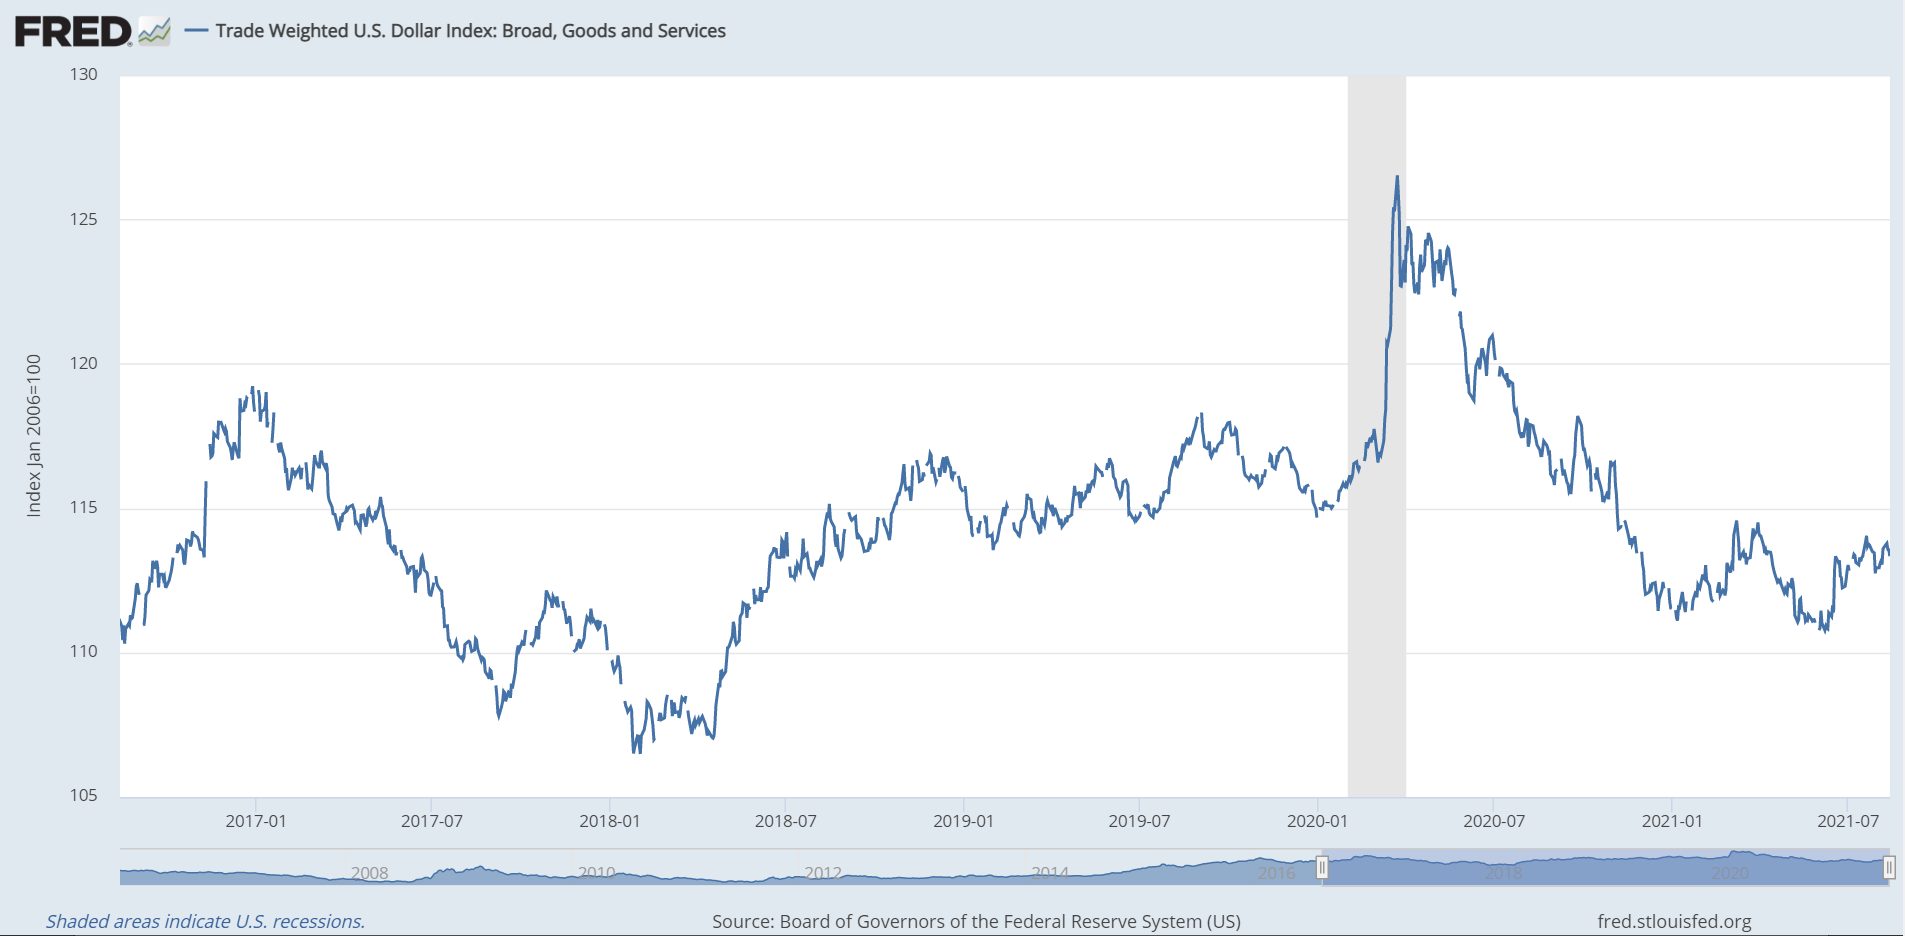
The trade-weighted dollar has yet to break out, but it is coiling in that direction.
The danger in a rising dollar scenario is from all the USD denominated debt globally. Rising just a few percentage points can have dire consequences on businesses around the world, especially when they are already in recession from government responses to the pandemic.
It's hard to know what comes first, the economic trouble or the rising dollar. It's a bit of a chicken and egg problem, but we can deduce that a rising dollar correlates to building global economic stress.
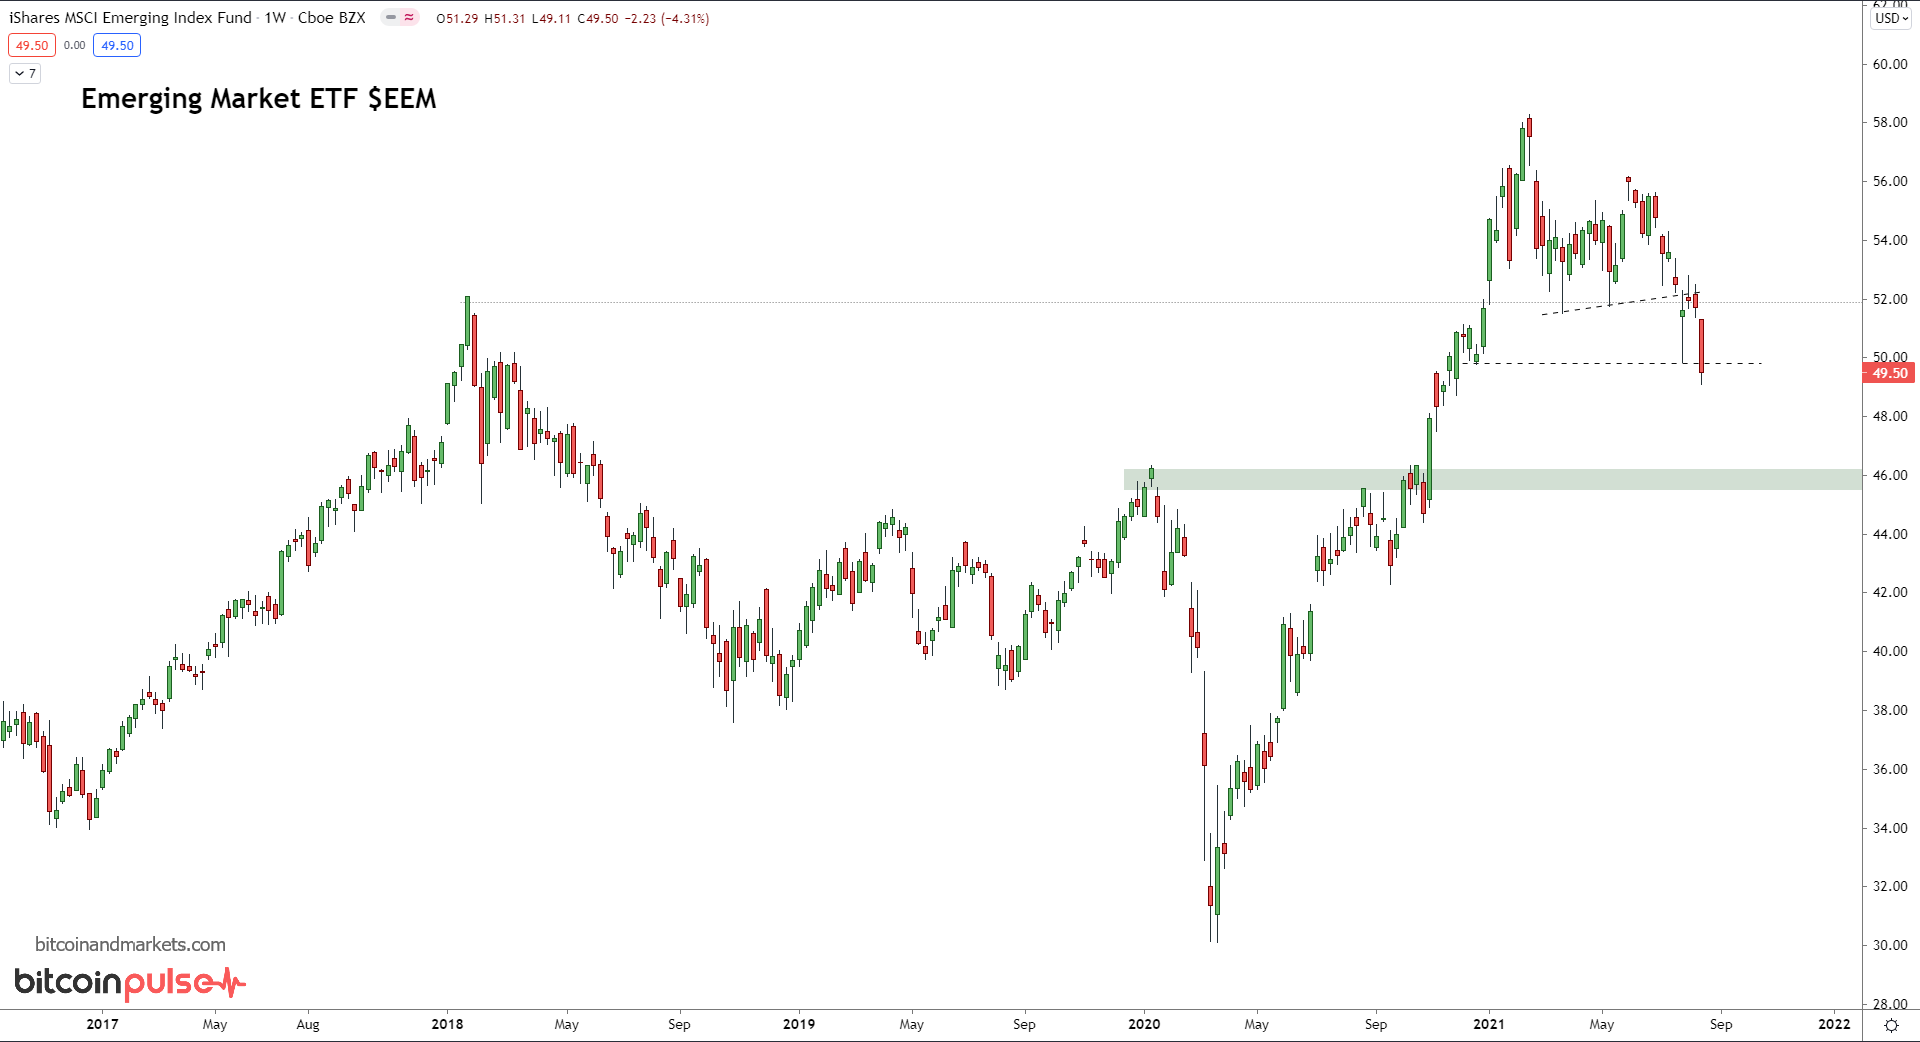
Emerging Markets are already heading down
This is one sector I'm watching daily. Emerging markets are set to feel the brunt of economic stress from a rising dollar. Remember, emerging markets used to be known as the "third world", and in an era of deglobalization, they will all likely return to their pre-globalization paths. I know that is extremely unpopular to say, but it's a fact that some areas are just uneconomic to develop without easy credit and guaranteed market access.
Oil WTI
Crude is falling off a cliff. The bulls have evaporated in the last two weeks, as predicted, the roll over and weakening of the global economy, along with a rise in US oil production once again, is really hurting oil prices.
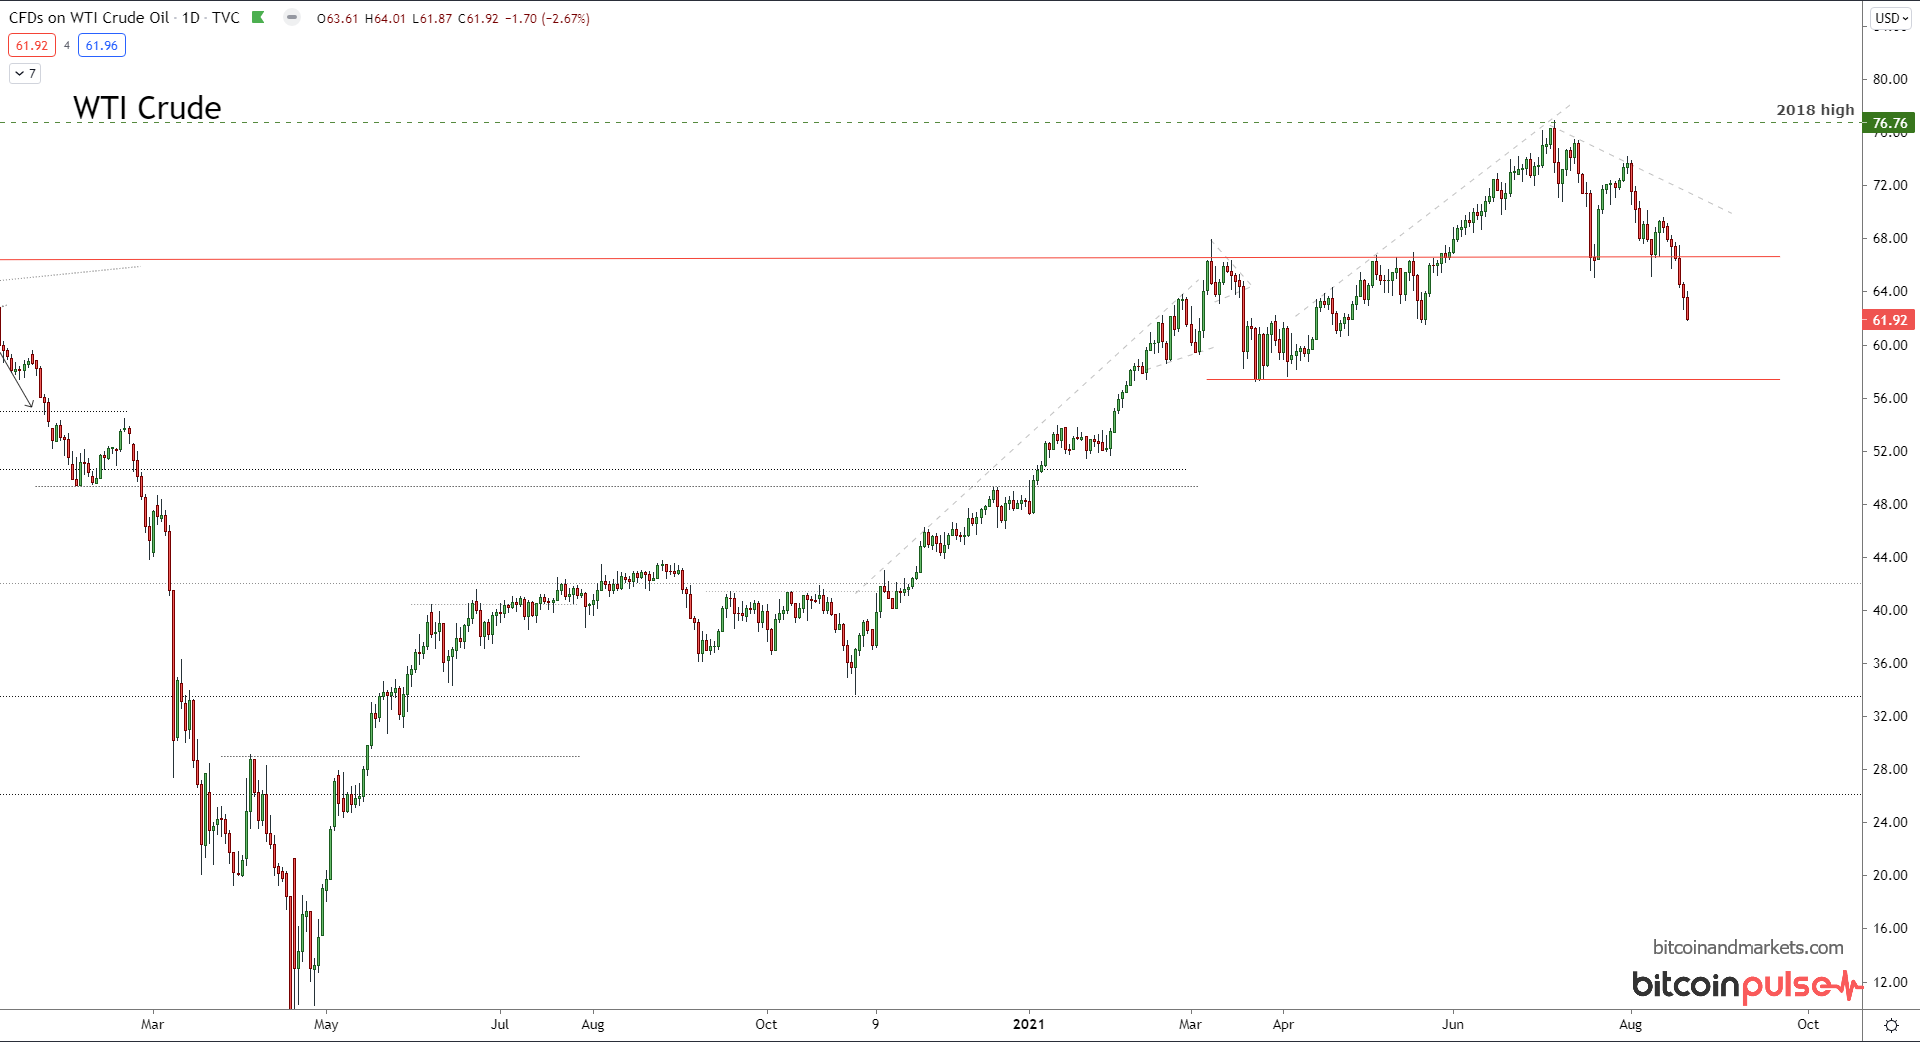
It is still above $60/bbl, closing Friday at the lows of $61.92. This will have drastic consequences on Month-over-month CPI for August. Even with the embarrassment in Afghanistan and the instability it could portend for the wider Middle East, oil has continued to fall.
How often have we seen that in the recent decades? Every time there is a negative development in that region of the world, oil prices spike not fall. Does that mean it would have fallen further, that the demand is so bad that even with the bullish news, prices crashed? Maybe.
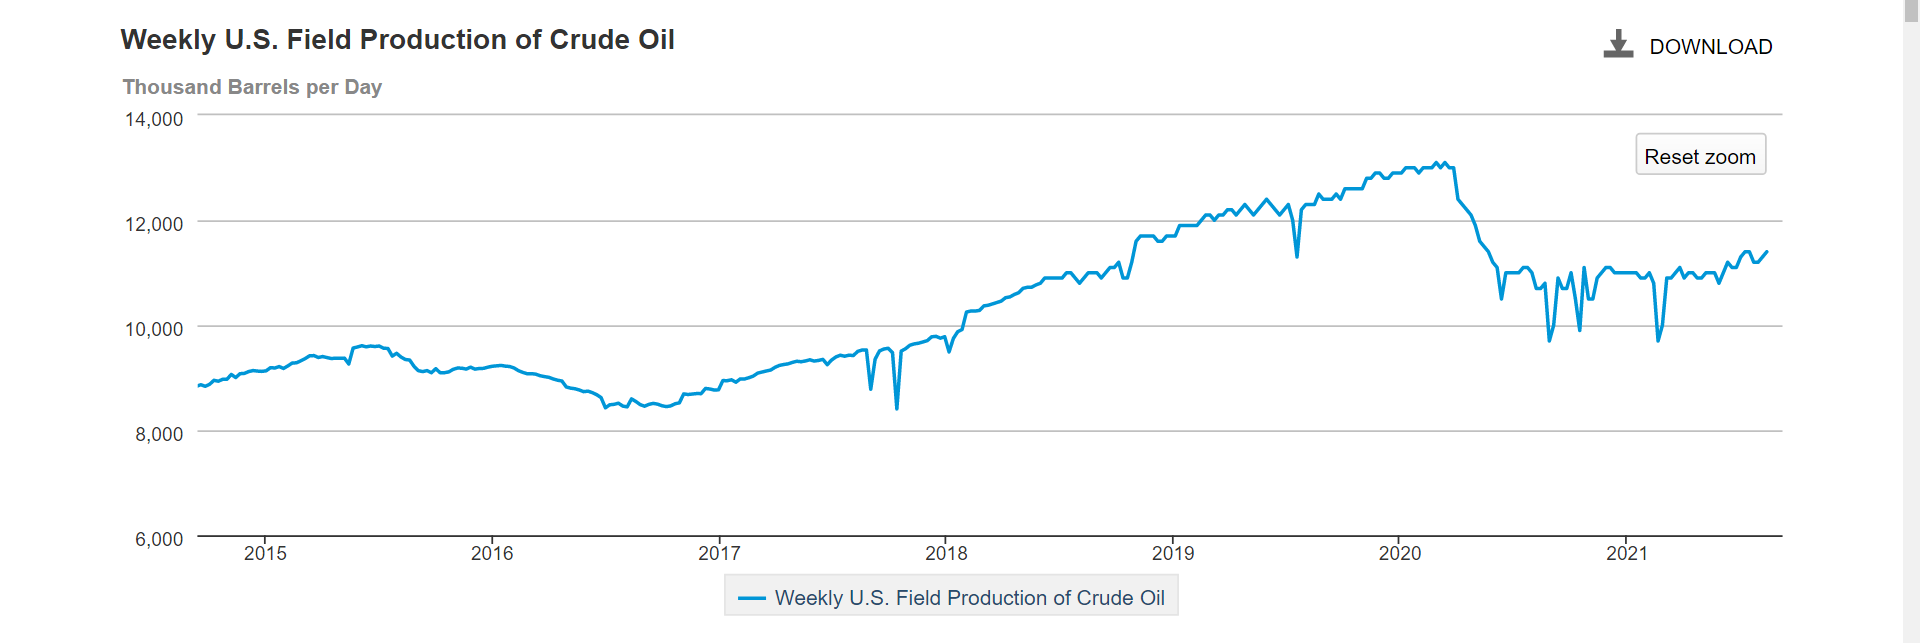
Oil production is a slow beast. Once it gets going it does not change direction quickly. Of course, the corona crash was an extreme event we likely won't be repeating anytime soon, but since production has started to rise again.
Here is a further zoomed out view. Notice the very slow and smooth trend changes.
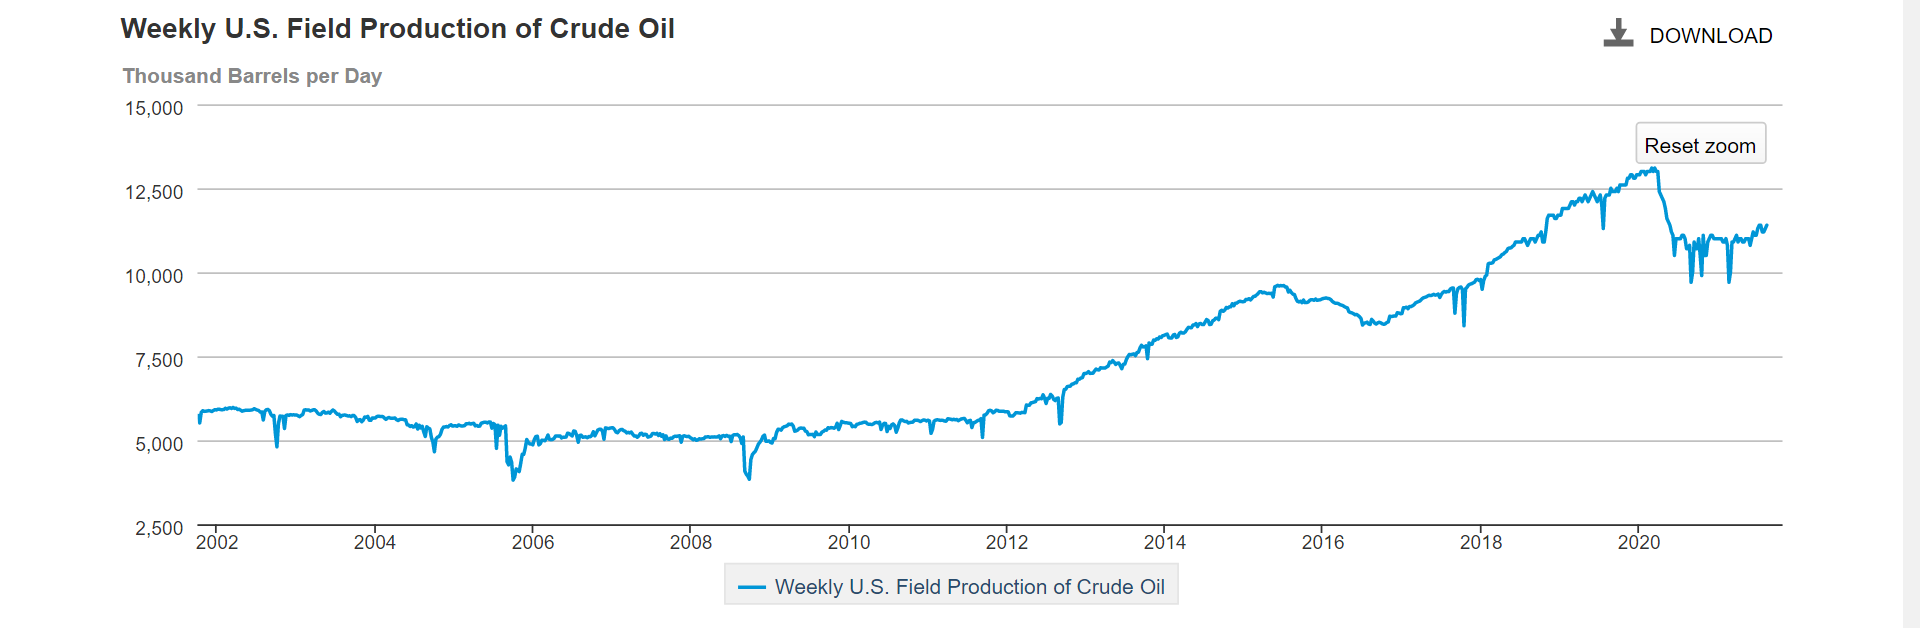
As the US industry finds its footing again, production will increase. Perhaps not at the same rate as the last decade, but it will trend back up as global demand remains stagnant. As oil prices drop, it is going to cause an even greater destabilizing effect in the Middle East and emerging markets.
I've said that it will be hard for oil to remain above $60, and I stick with that assessment. Over the next few years, with decreasing global demand, decreased US military demand, and growing US production, a range should form between roughly $45-$65. This would be similar to oil's behavior many times in the past, including 2000-2003, 2011-2015, 2016, 2019, and others, of course at different levels. In each of those periods the price consolidated in a range for an extended period before picking a direction.
Gold is wondering in no man's land
#Gold getting crushed! pic.twitter.com/LzoLKmbrYv
— Ansel Lindner (@AnselLindner) August 8, 2021
After this epic sell off, price has stabilized. But how is this possible? If there is as much inflation as people are ranting and raving about, how can the price of gold be falling? How can it be 7% below its 2011 high???
The answer is obvious, other prices are not inflation. Gold's price does track inflation decently well in inflationary environments, and is also acts as a hedge in deflation environments. Other prices increase for many reasons that don't have to do with the money supply. If you believe that in general prices are inflation you are dooming yourself to confusion and dissonance.
Why is a supply chain shortage's effect on prices considered money printing?
— Ansel Lindner (@AnselLindner) August 17, 2021
Deflation, or the shrinking of credit, can easily cause price increases. Any time you shrink the supply of a thing and demand stays stable, prices will go up. That is not inflation. It is likely do to tight money throughout the supply chain, which in turn can lead to a breakdown in the economy, and even further troubles in servicing debt. If it gets to the point of default, that is a destruction of money event. It's deflationary.
Anyway, back to gold. Gold shows us that the supply of liquid useful dollars is not exploding.
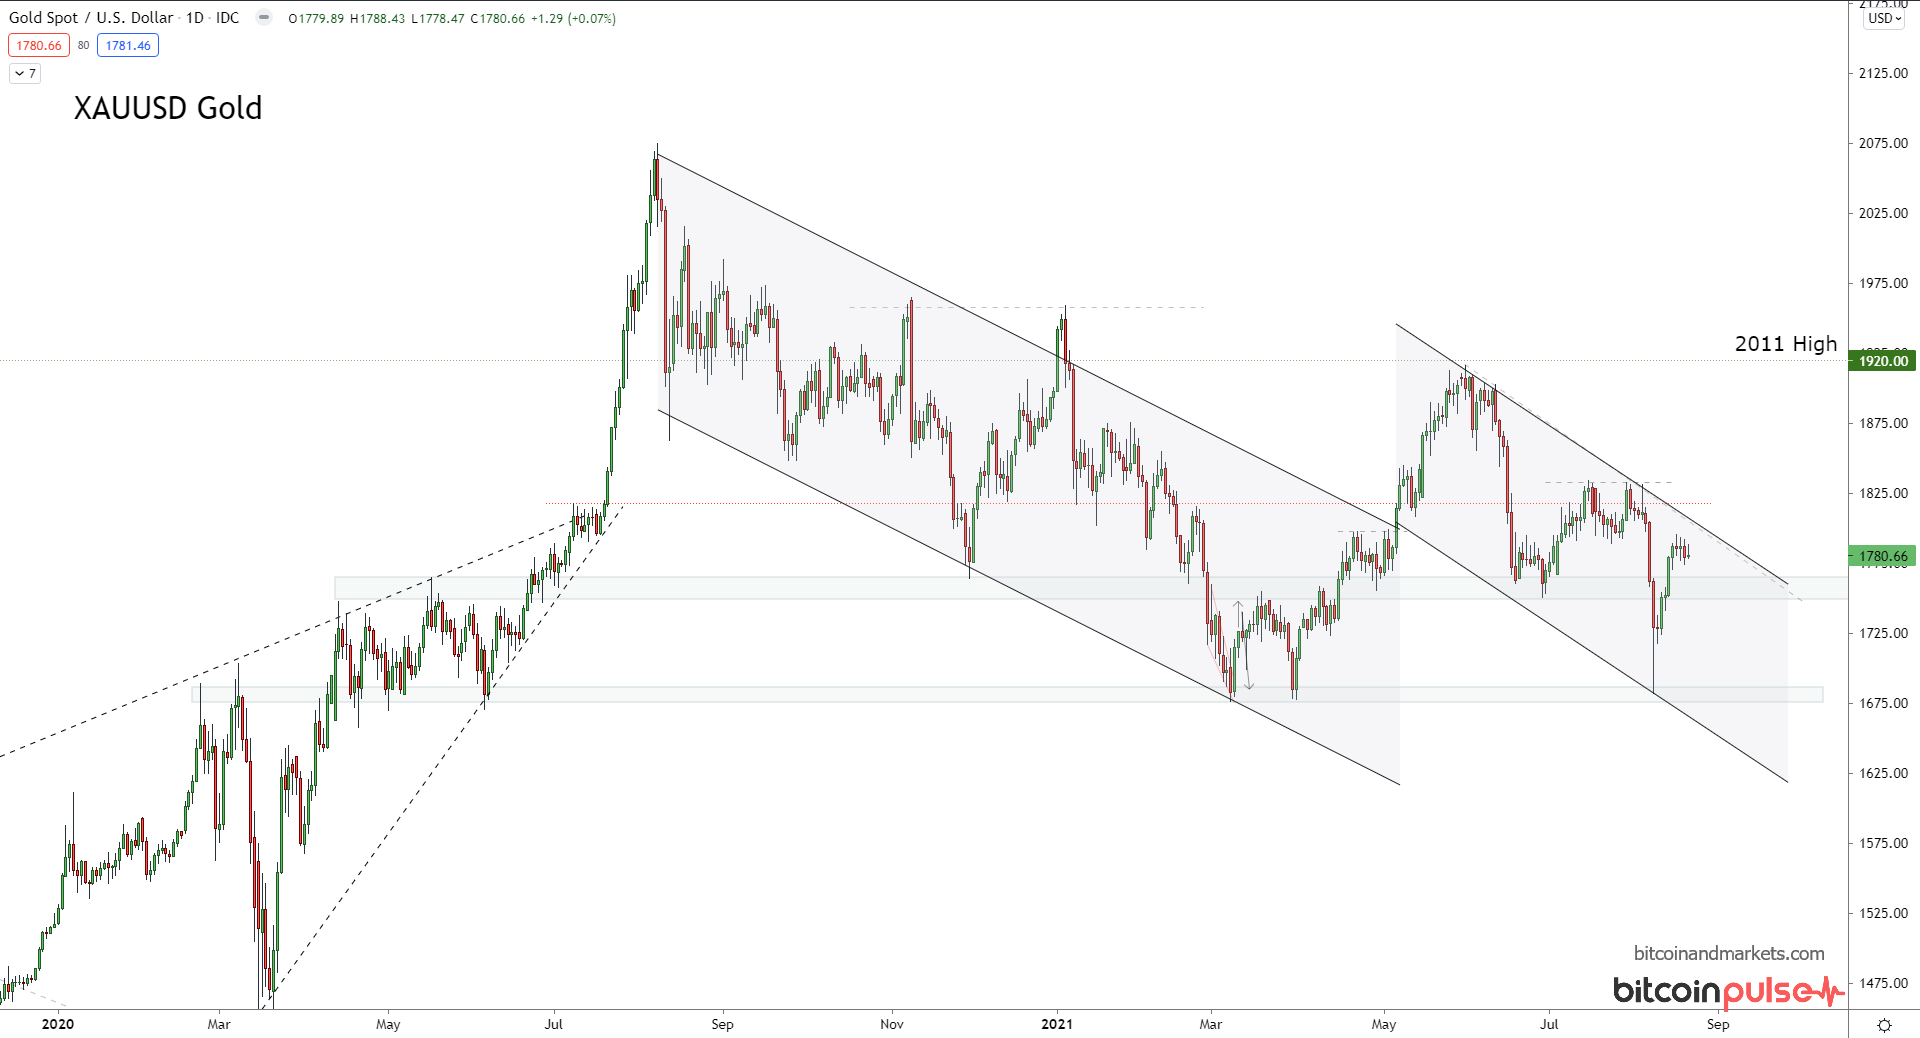
Gold hasn't been easy to predict in this range, but it is generally weaker or sideways. I've added some new channels to my gold chart. Levels of interest are $1800 on the top and $1700 on the bottom. If gold bulls can manage to push price above $1800 then more upside is likely. However, on the downside, $1700 would be a break of the double bottom and be very weak indeed.
My overall position on gold stands. I think it will counterintuitively benefit from a strengthening dollar for the same reason as bitcoin will. People will be moving to sound money in a deflationary environment because other investment opportunities will be more risky. However, with bitcoin in the world, gold will struggle in relation.
Inflation expectations and interest rates
Lastly, let's talk about inflation expectations and Treasuries. Below are the major inflation expectation measures, 5y 5y Forward, 5y Breakeven, and 10y Breakeven.
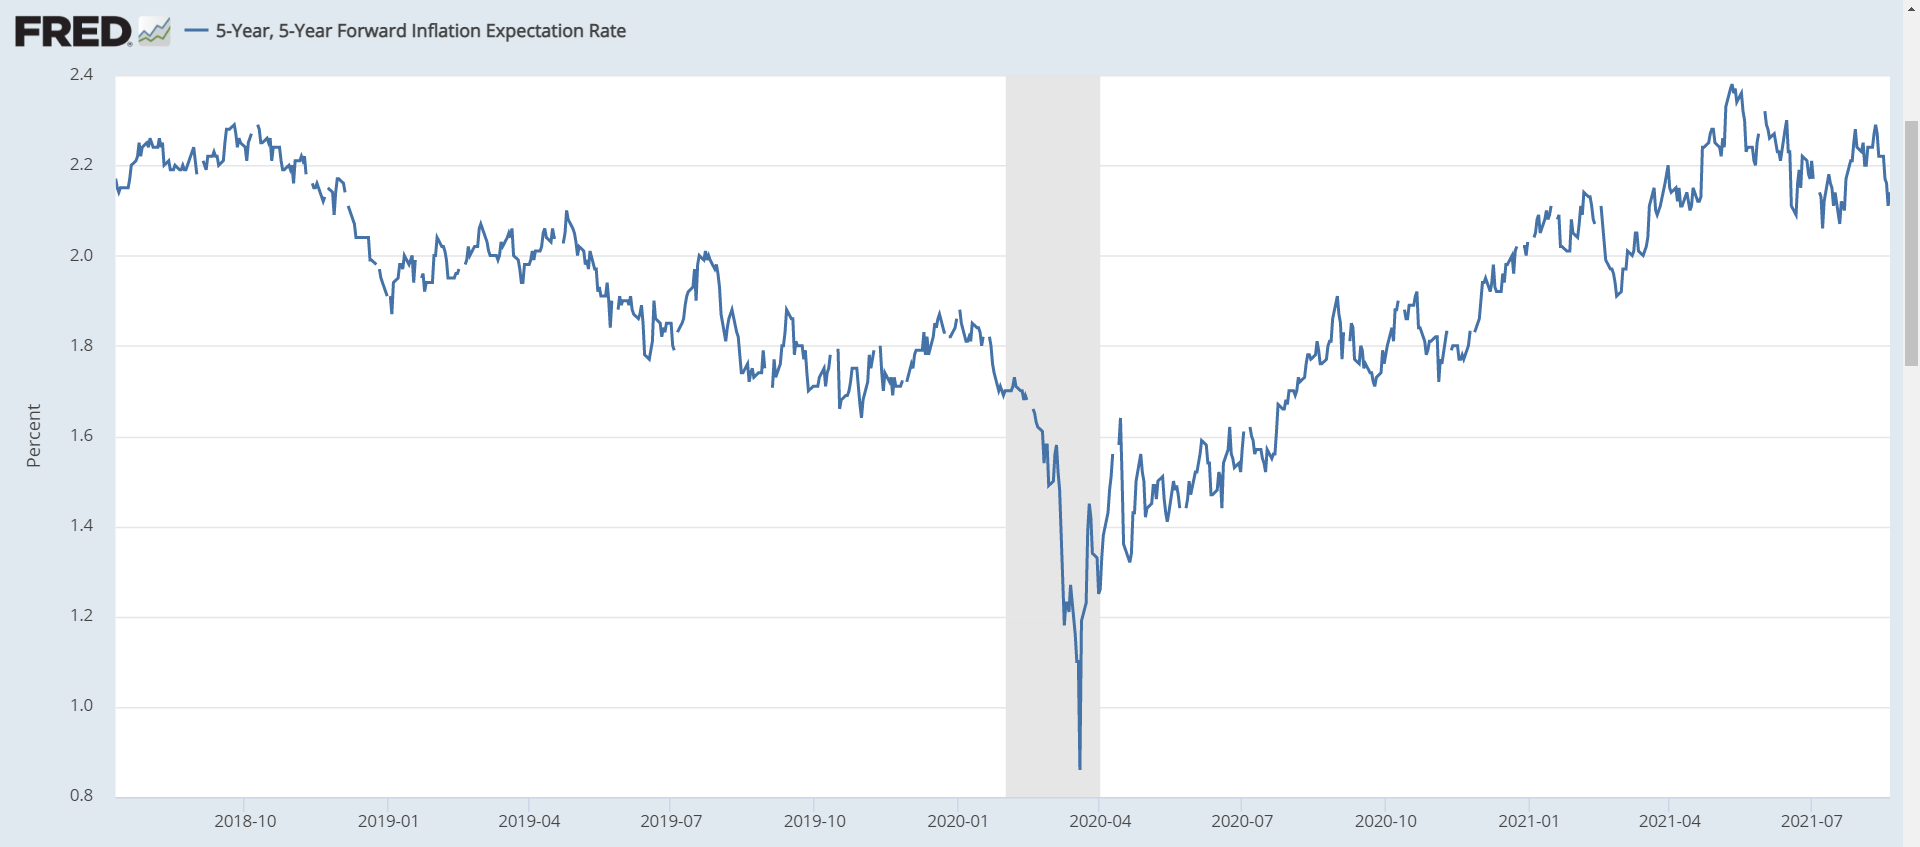
As you can see on the 5y 5y forward, inflation expectations are just above 2%. They have topped and are now falling. People are not acting like there is going to be high inflation.
When you realize that Fed policy boils down to expectation management, you know they depend on people acting as if there is going to be inflation in order to manifest it in reality. These charts says, no way!
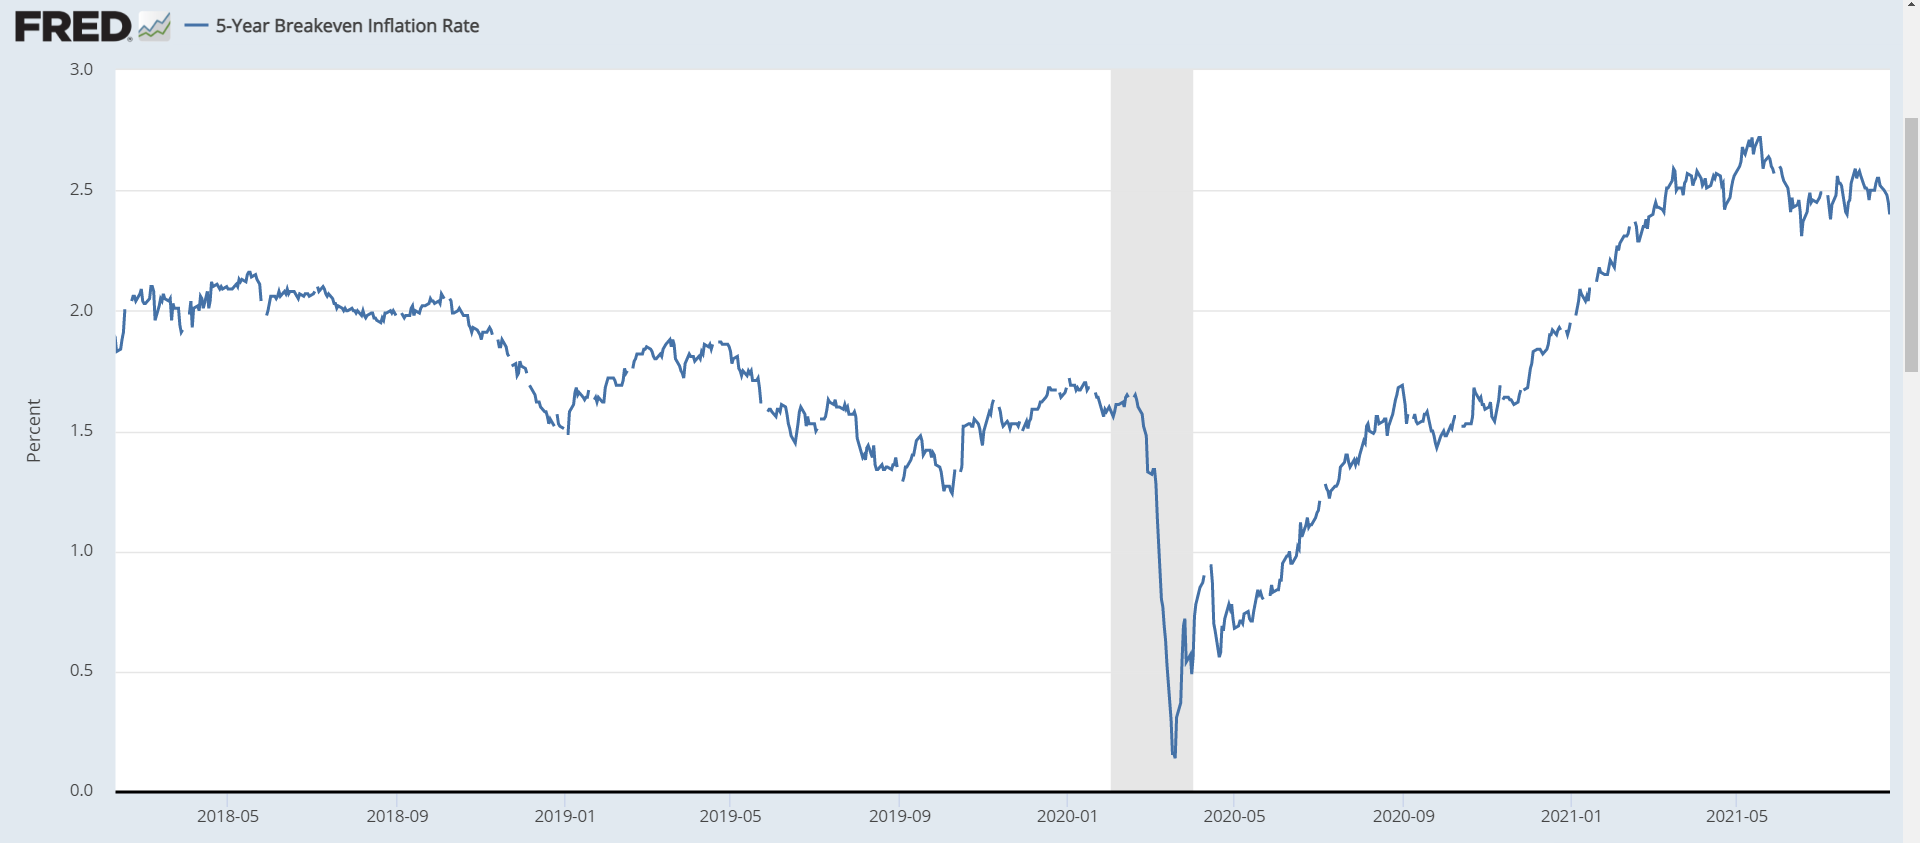
Under 2.5% on the breakevens and also looking like they have topped and are rolling over.
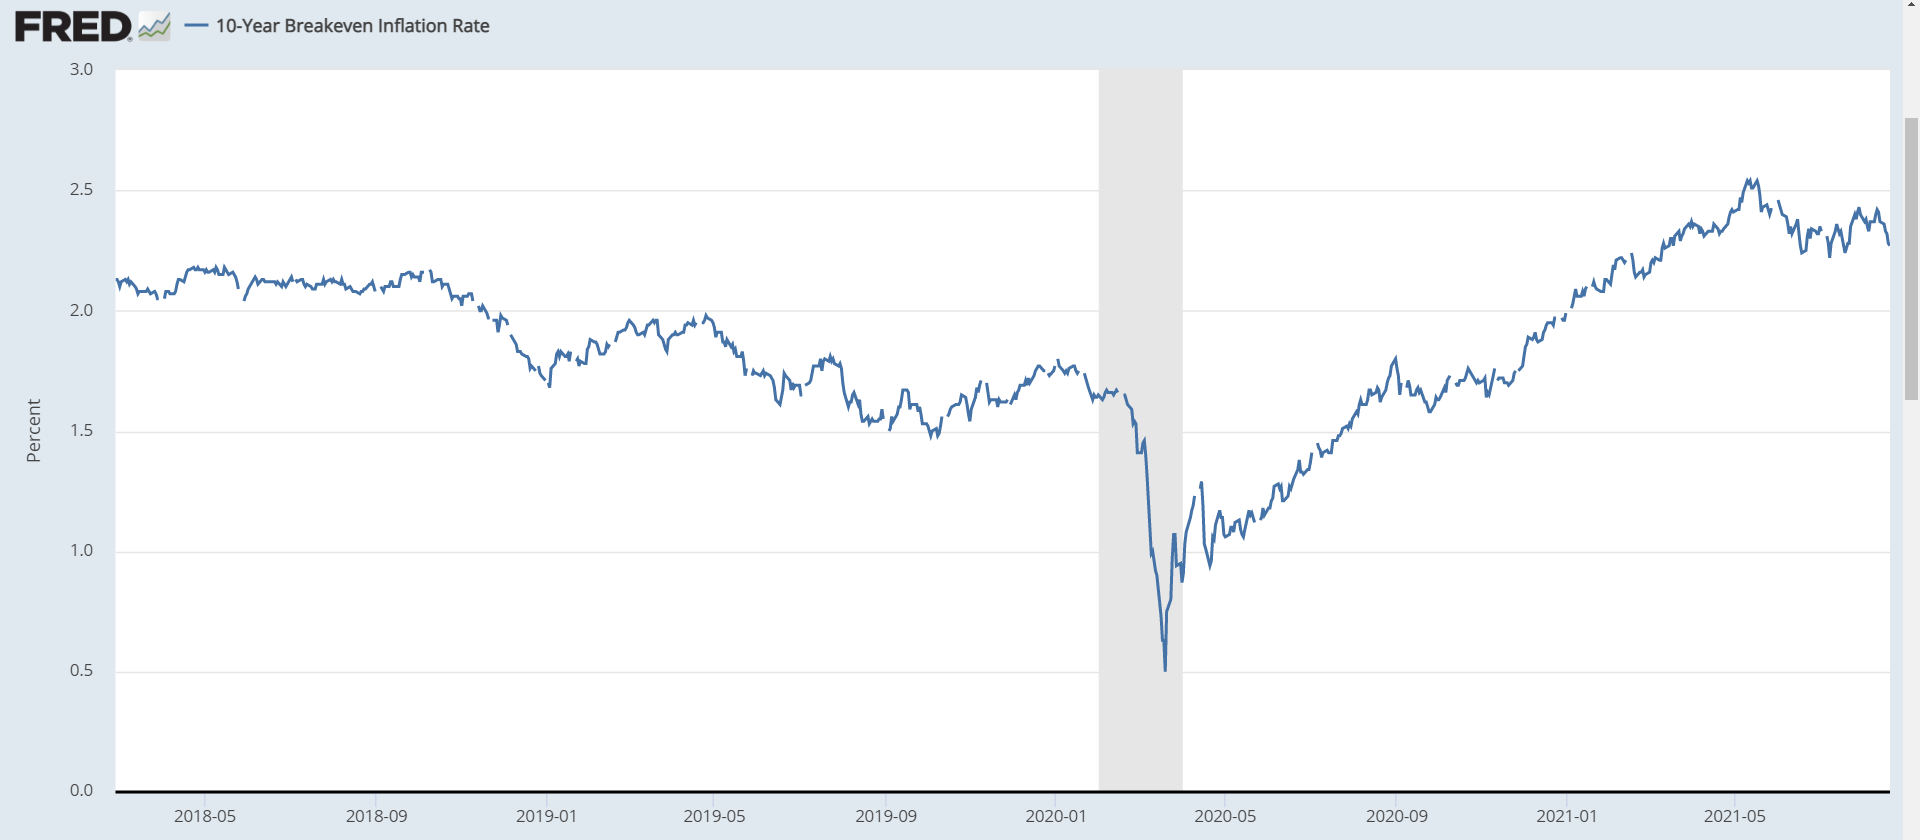
The above three charts alone should be a huge hint that inflation is not going to pick up in the near future. But wait, there's more.
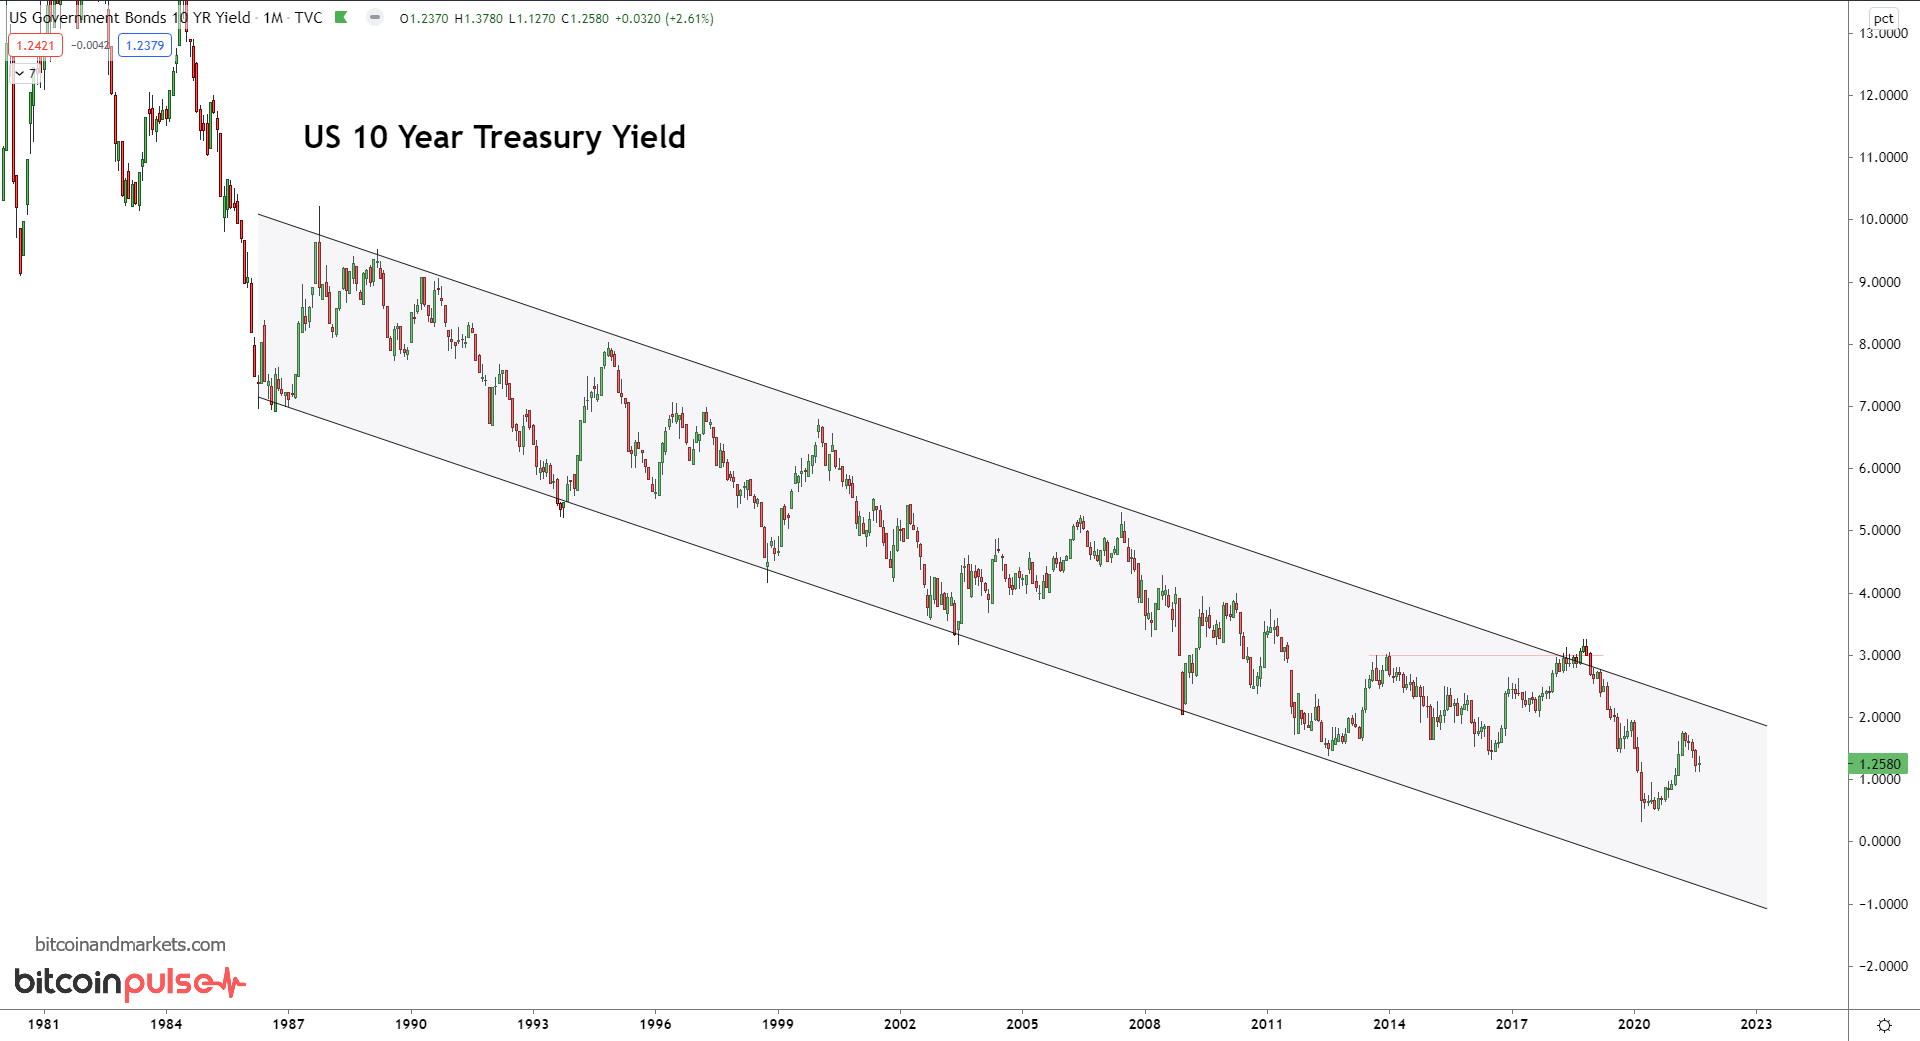
The 10 Y yield continues in its generational down trend. Terminal down trend in my opinion. If rates don't rise, there can't be inflation. Low rates mean tight monetary conditions.
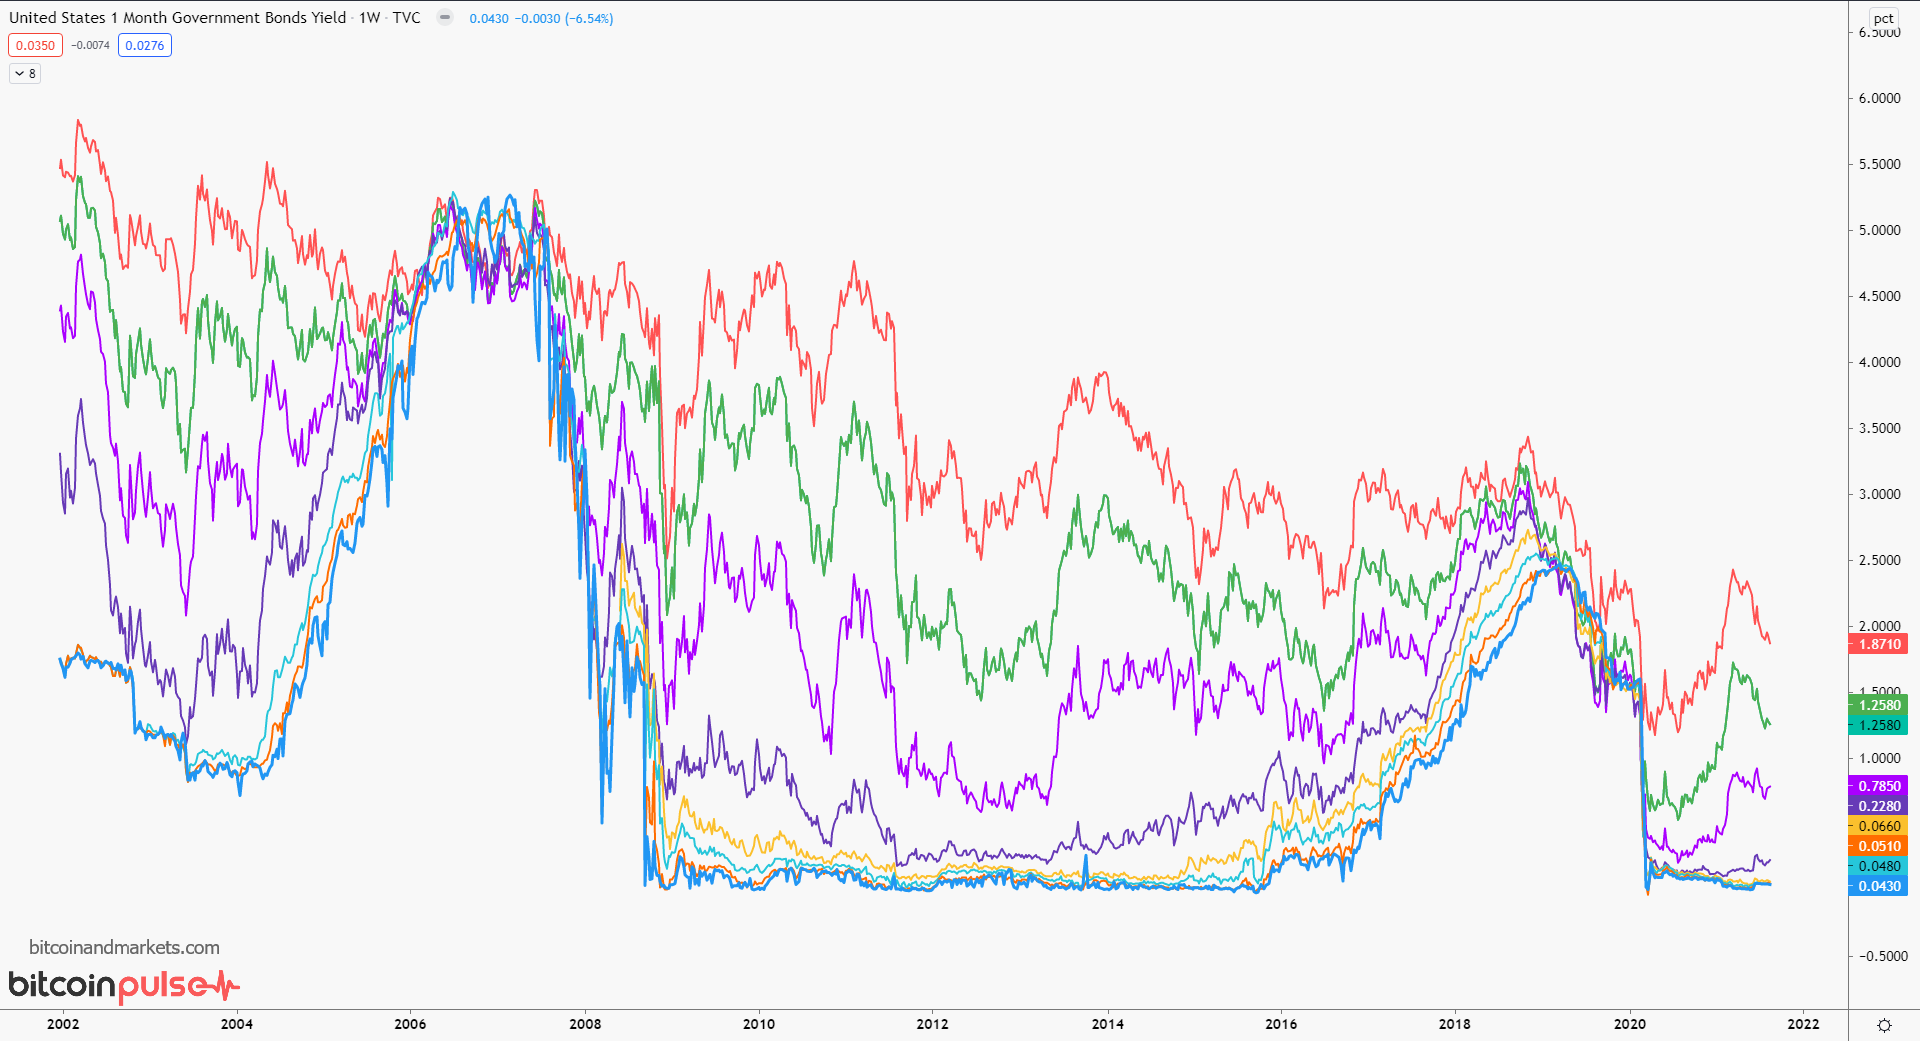
The debt trap and inevitable deflation becomes glaring looking at the behavior of all Treasury yields on one chart. Here we have the 3, 6 month, 1, 2, 5, 10, and 30 year rates. What do you notice?
That's where I'm going to leave for this issue. Questions or comments, reach out on twitter to @AnselLindner.