Macro Chart Rundown - 25 Jan 2022
In this post: Ukraine situation, Oil and natural gas prices, Oil production rising, Fertilizer cost, US yield curve, Dollar (DXY), and Shipping costs

If you like this content, SUBSCIBE and SHARE! Thank you.
In this post:
- Ukraine situation
- Oil and natural gas prices
- Oil production rising
- Fertilizer cost
- US yield curve
- Dollar (DXY)
- Shipping costs
Russia and Ukraine
I've been talking about the Russia/Ukraine situation every chance I get over the last couple of months. Well, I think the threat of open hostilities is peaking right now for roughly the next few weeks. If Russia waits much more than that, the spring thaw will make the terrain more difficult for Russian tanks.
Additionally, a Russian flotilla from the North Sea is steaming toward the Black Sea to arrive within the above window of time, possibility full of an amphibious assault force. Next, recently passed Russian legislation about mass casualty events goes into effect on Feb 1. And finally, the west is sending more and more weapons into Ukraine. Any delay will only give more time for NATO allies to weave a web, make demands or ultimatums.
Russia at least wants to keep pressure up, if not trigger a conflict. They recently made demands that Romania and Bulgaria get booted from NATO, and return it to an previous state of membership. They have to know that that demand is impossible.
So what happens if we see a February 1st, or thereabouts, incursion? Russia would sweep right through the country. Ukraine is unable to put up any real fight at all. The entire thing would take a few days, maybe a week. At least the southern sections of the country, from the Donbas to Odessa, would be occupied by Russia, and it's possible that they take everything east of the Dnieper river.
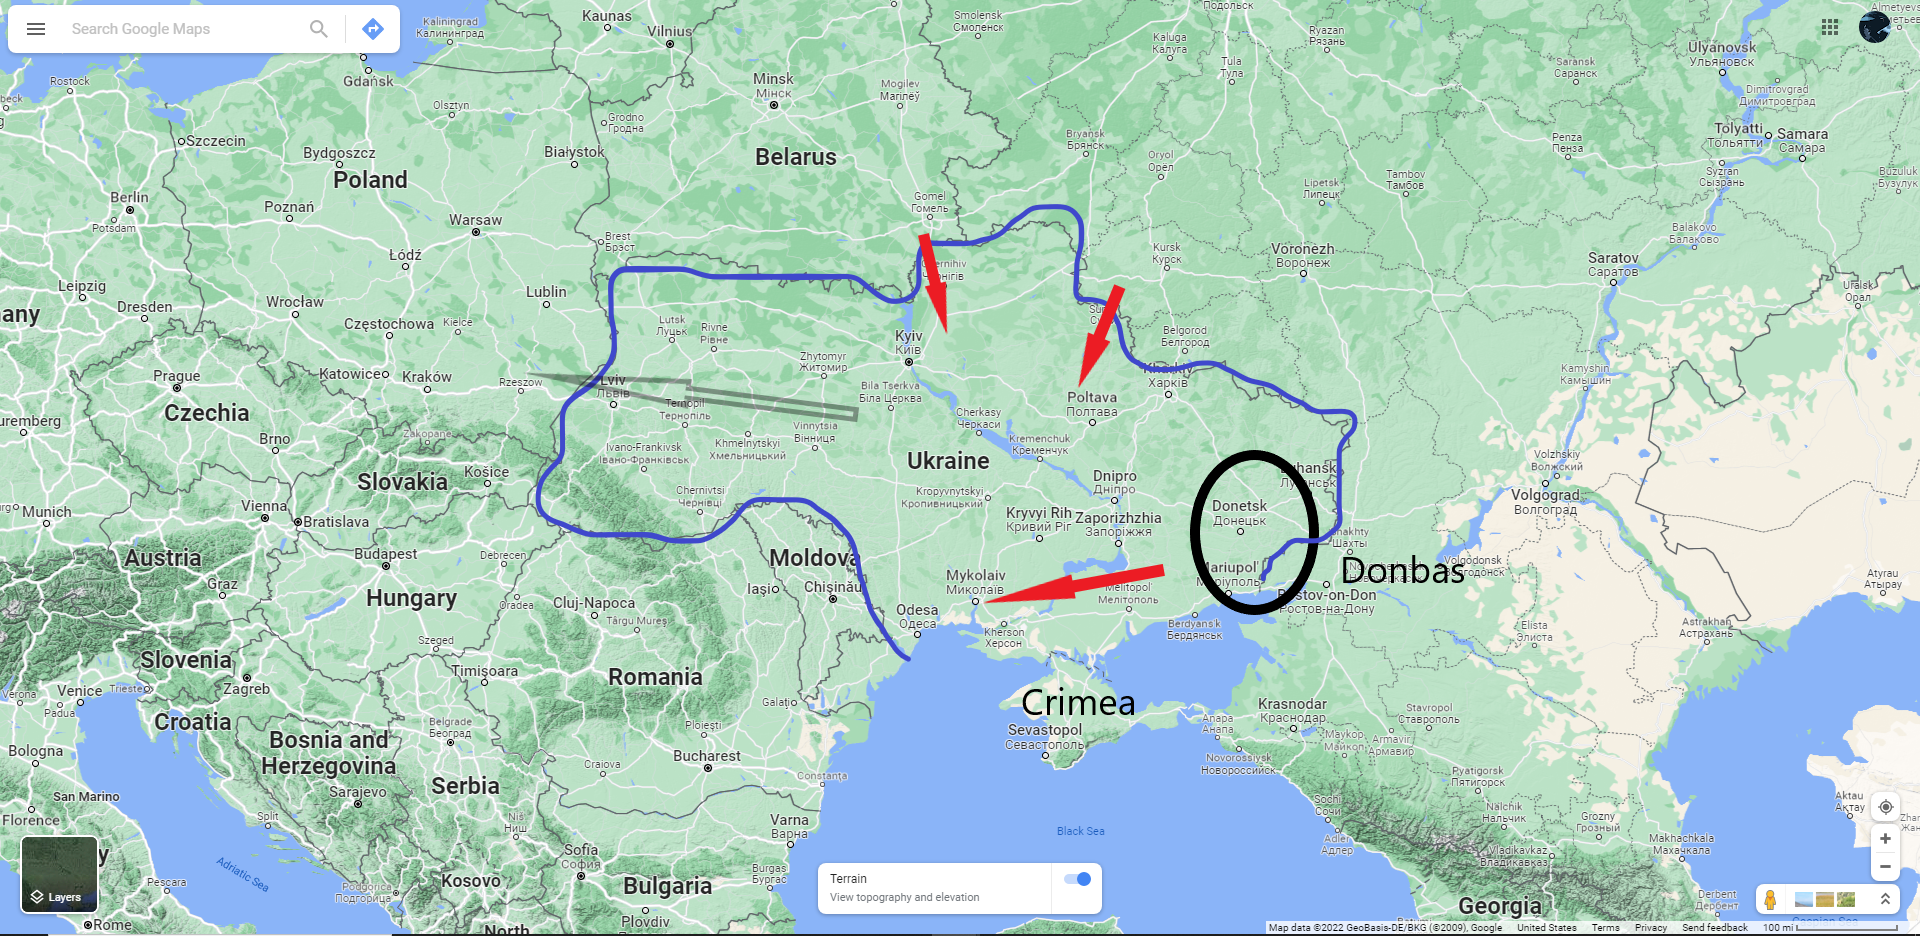
Poland and Hungary are vocally opposed to everything Russia does. They are worried that Russia could continue West (as in the faint black arrow), right into the heart of Europe. The interests of a strong Russia will always outweigh any Polish, Baltic, or Balkins' interests, a situation the latter places are desperate to avoid. As of now, Germany doesn't seem to care, they are keeping their mouths shut and stopping NATO countries where they can from sending weapons to Ukraine.
I see a conflict in Ukraine causing massive stress inside the EU. It will affect their economies, energy prices, and currency.
Energy
We've been following the natural gas crisis in Europe together for months. Let's check in on the charts.
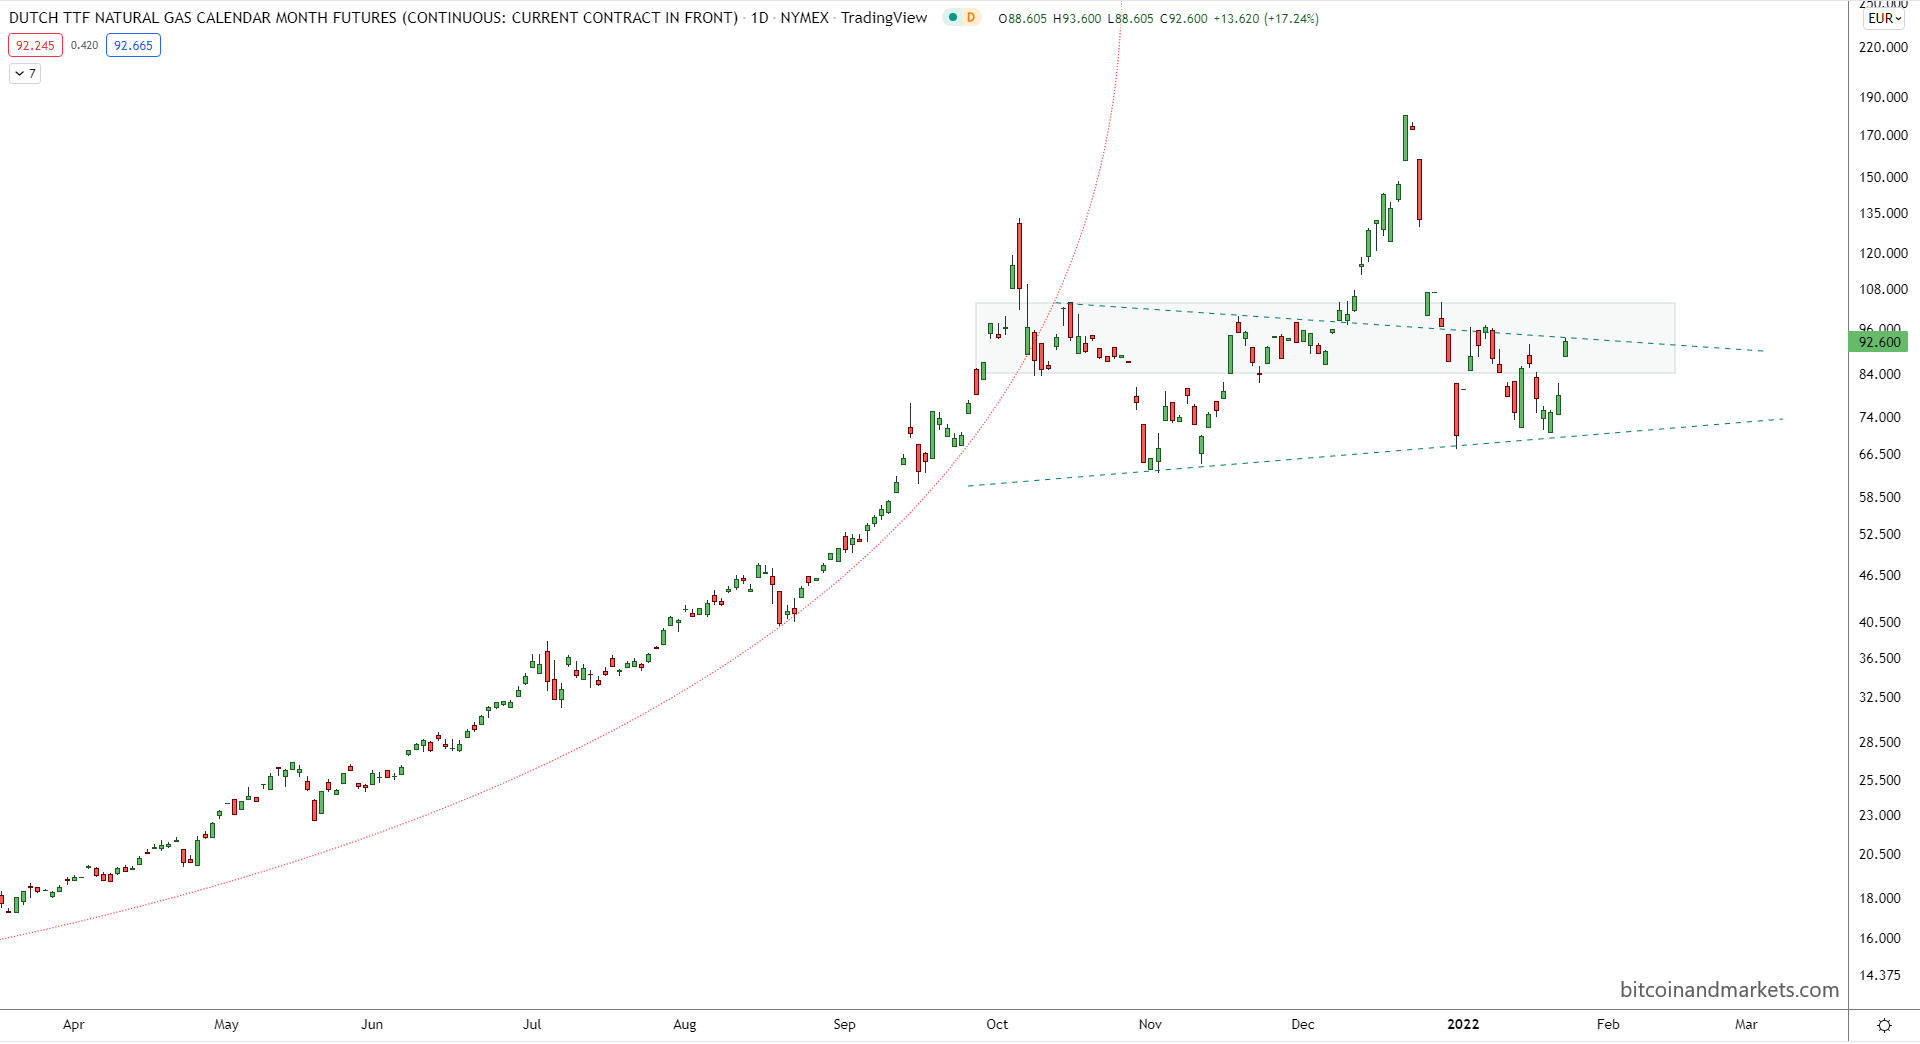
In the last month, Dutch natural gas futures made a new high, but is now consolidating in a well-traffic'ed zone. Remember, the above chart is on a log scale, so the current prices and volatility are much worse than they look. I did it this way to get the whole trend over the last year in there, too.
If and when Russia invades Ukraine, these prices should spike, but do they get back to ATHs? That's less certain. The US is busy shipping all the gas we can to Europe, and there are rumors that Qatar has agreed to divert supply to Europe.
If the incursion is swift and there is little disruption to gas supplies, we could see a spike followed by a very large crash.
US Nat Gas Price
US natural gas prices are a completely different story. They remain only slightly elevated. And this is with diverting a bunch of gas to Europe already.
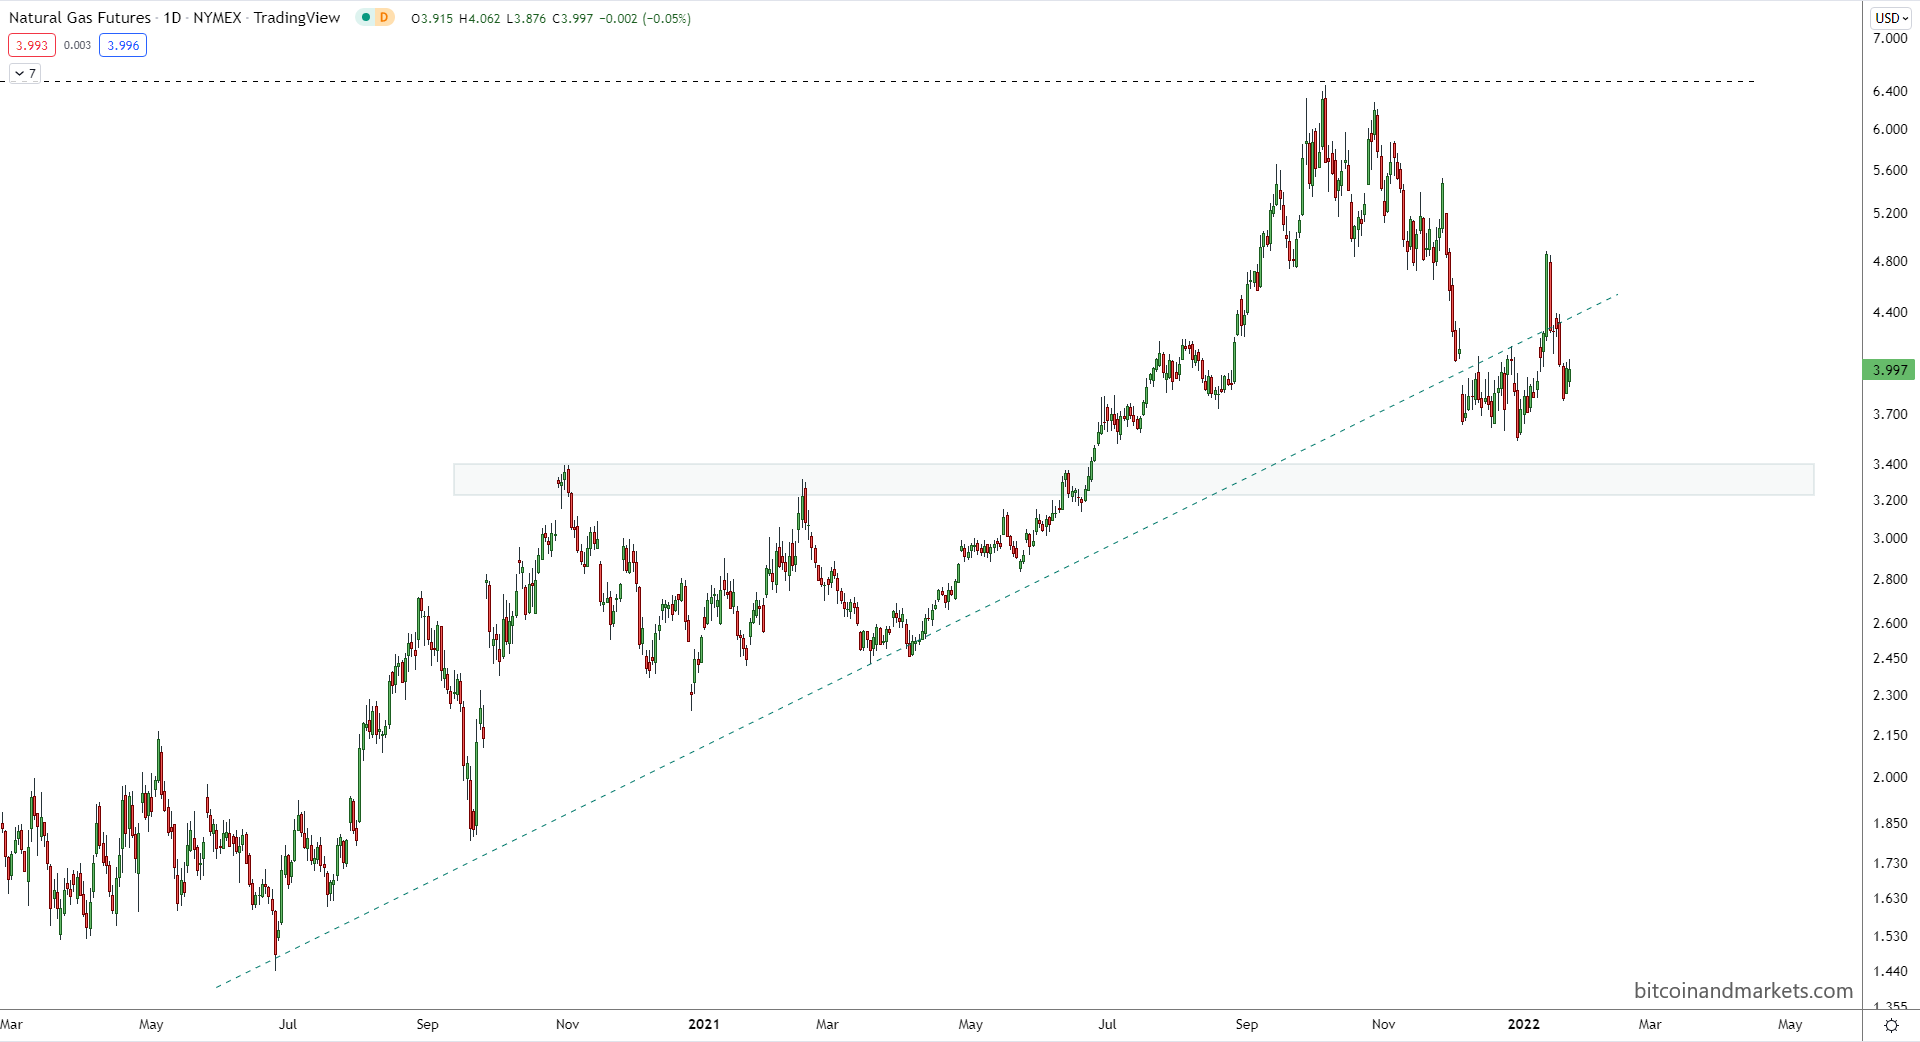
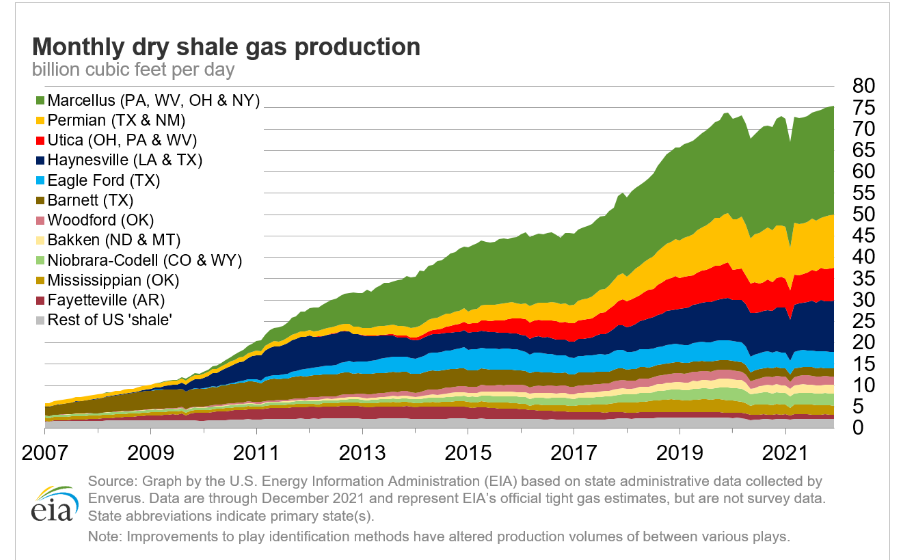
Here is a bonus chart of US shale gas production, and as you can see, it has recently hit new ATHs. I don't expect that to change anytime soon. Perhaps it will even accelerate.
Oil
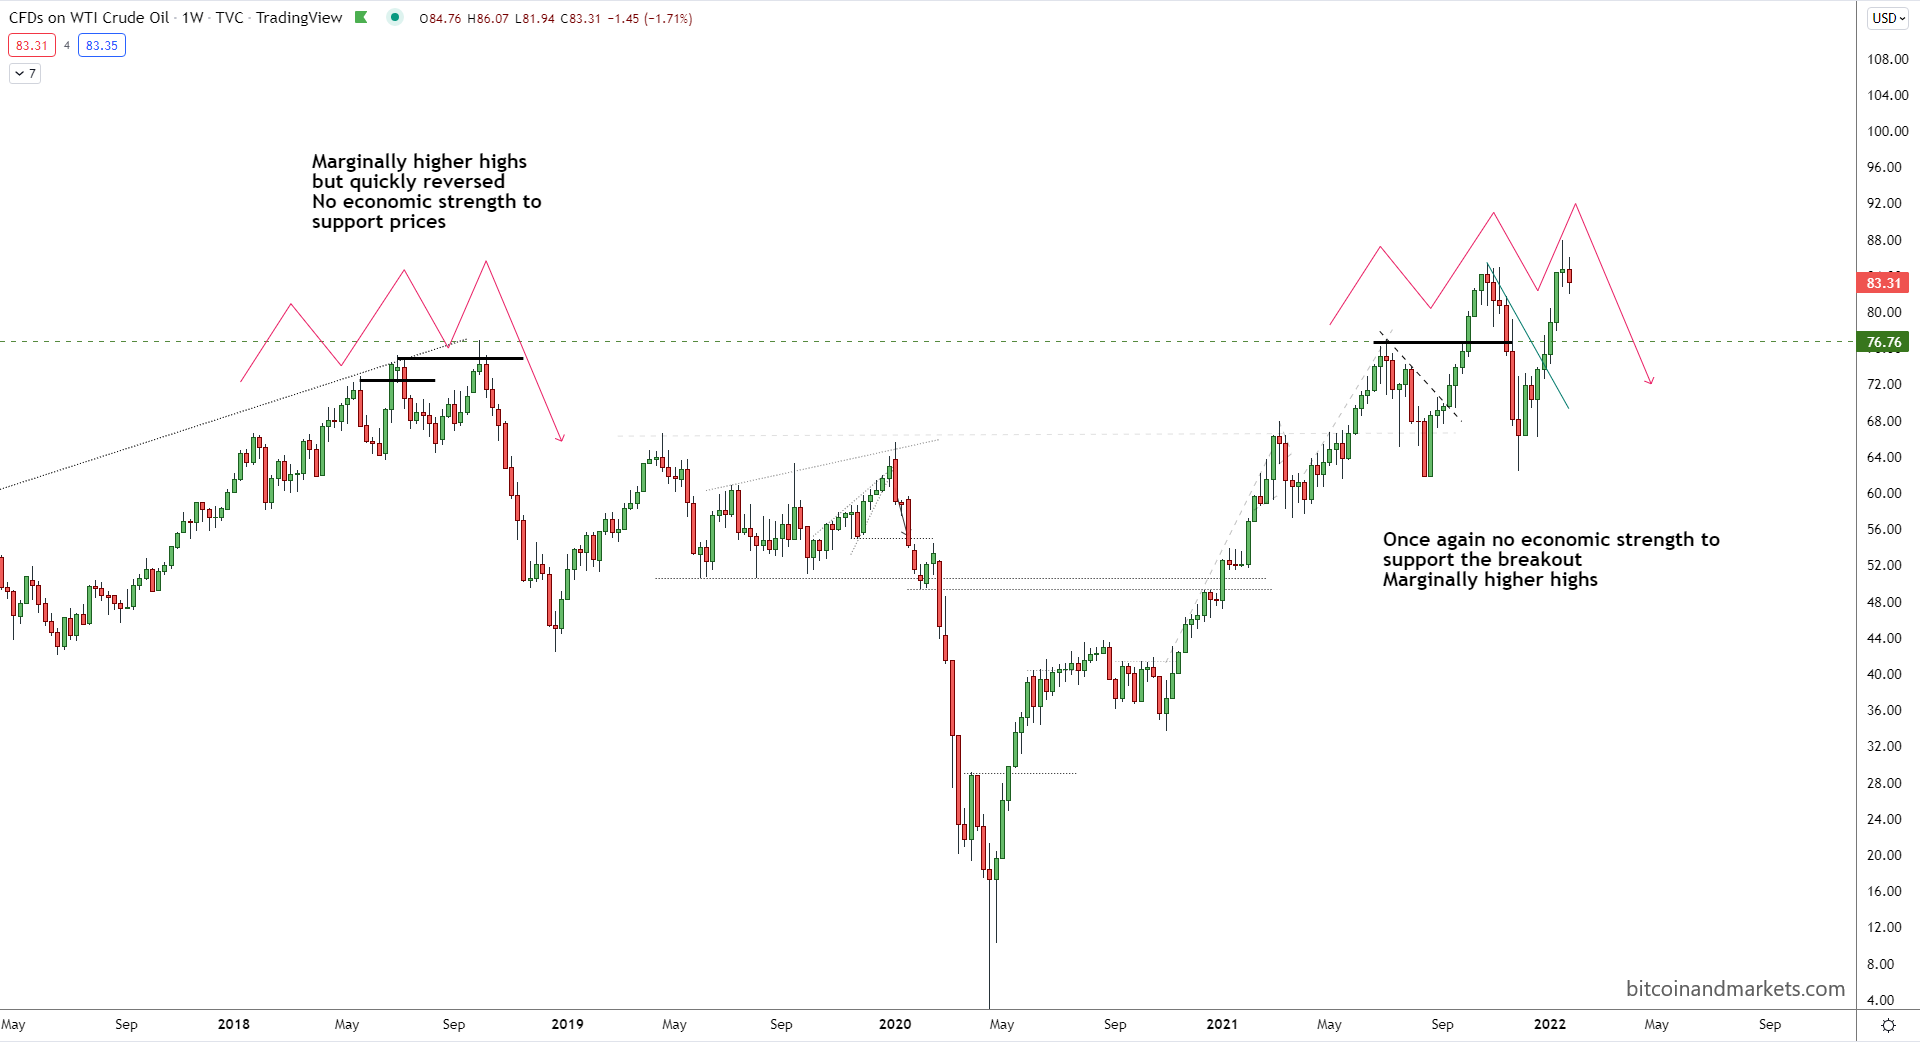
I have not moved the red arrows on this chart for months. All we hear from the scare-media is that oil is going to $100, no $200, no $300 bbl!
What a joke. Where is the demand going to come from to push oil up that high? The recent high prices have been because of the inflation-baiting. I expect oil prices to fall throughout the year, probably testing the $50 handle.
The wars of the last 30 years have centered in the Persian Gulf, around the large oil producing countries. The wars over the next decade will be further north in Central Asia, a much less important region for oil production. Therefore, war in Central Asia will mostly affect demand, not supply.
If oil prices fall, CPI will fall with it. I think the pivot in markets has already occurred. The US is not only the marginal consumer of this credit-based system, meaning the fate of the global economy rests on the US consumer, the US is becoming a strategic energy producer as well.
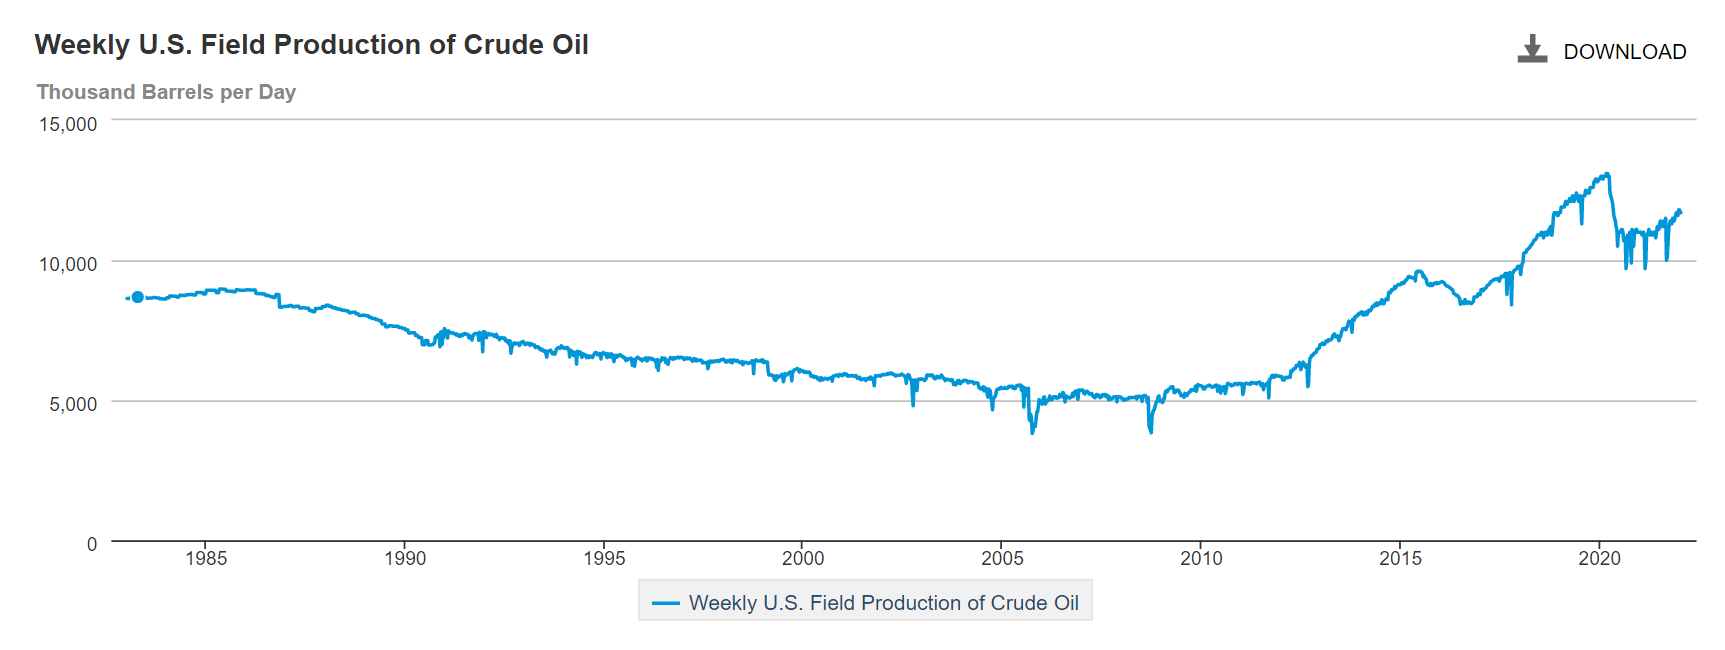
US Oil Production
US oil production is up.
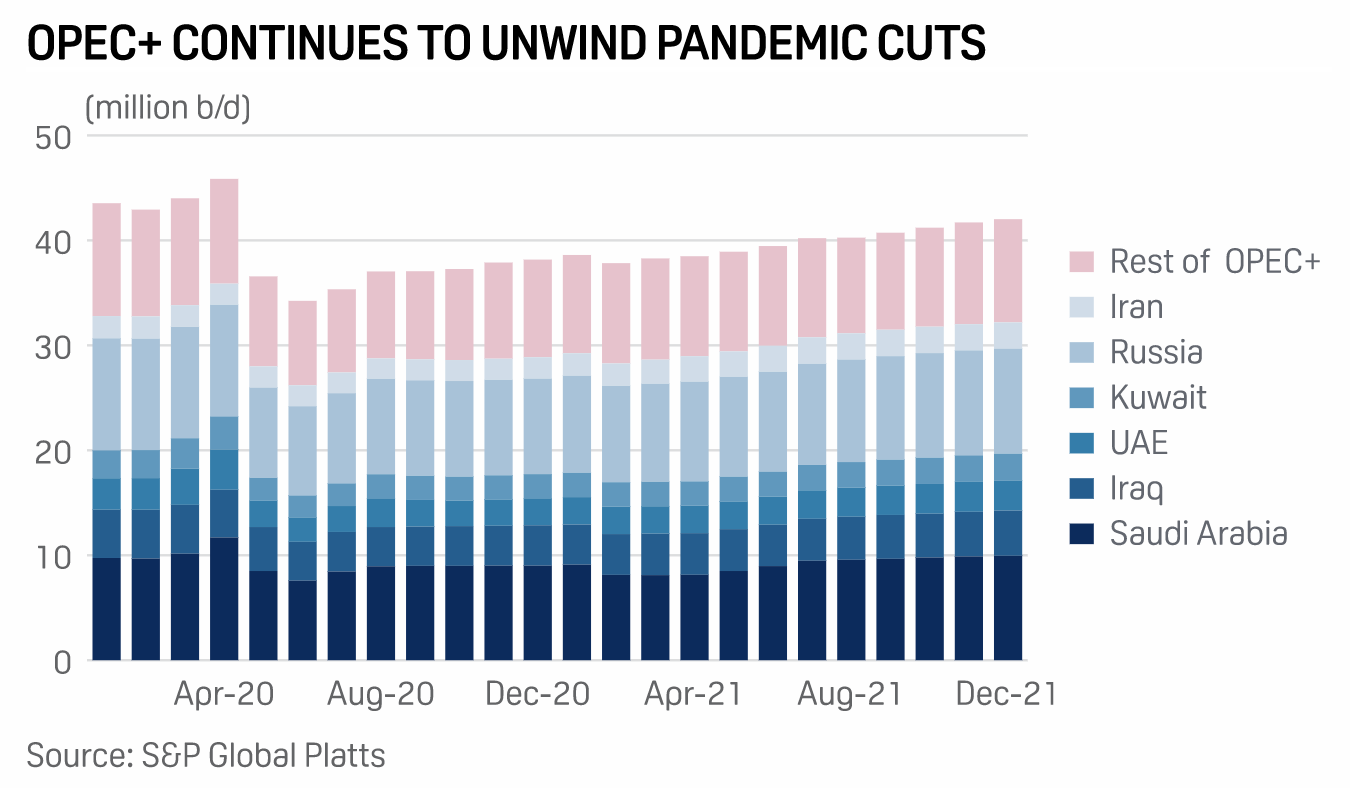
OPEC production
At the January 2022 OPEC+ they reaffirmed their decision to reverse all the pandemic cuts by a rate of 400,000 bbl/d per month. They have fallen short of that goal so far, with Dec seeing about a 190,000 bbl/d increase due to unforecasted Libyan oilfield disruption.
If the US increases 50-100,000 bbl/d every month, and OPEC is dedicated to 400,000, that means that as global demand is declining, and the economy is slowing, there will be a possible increased supply of 500,000 bbl/d of oil every month. I do not see how price could remain elevated.
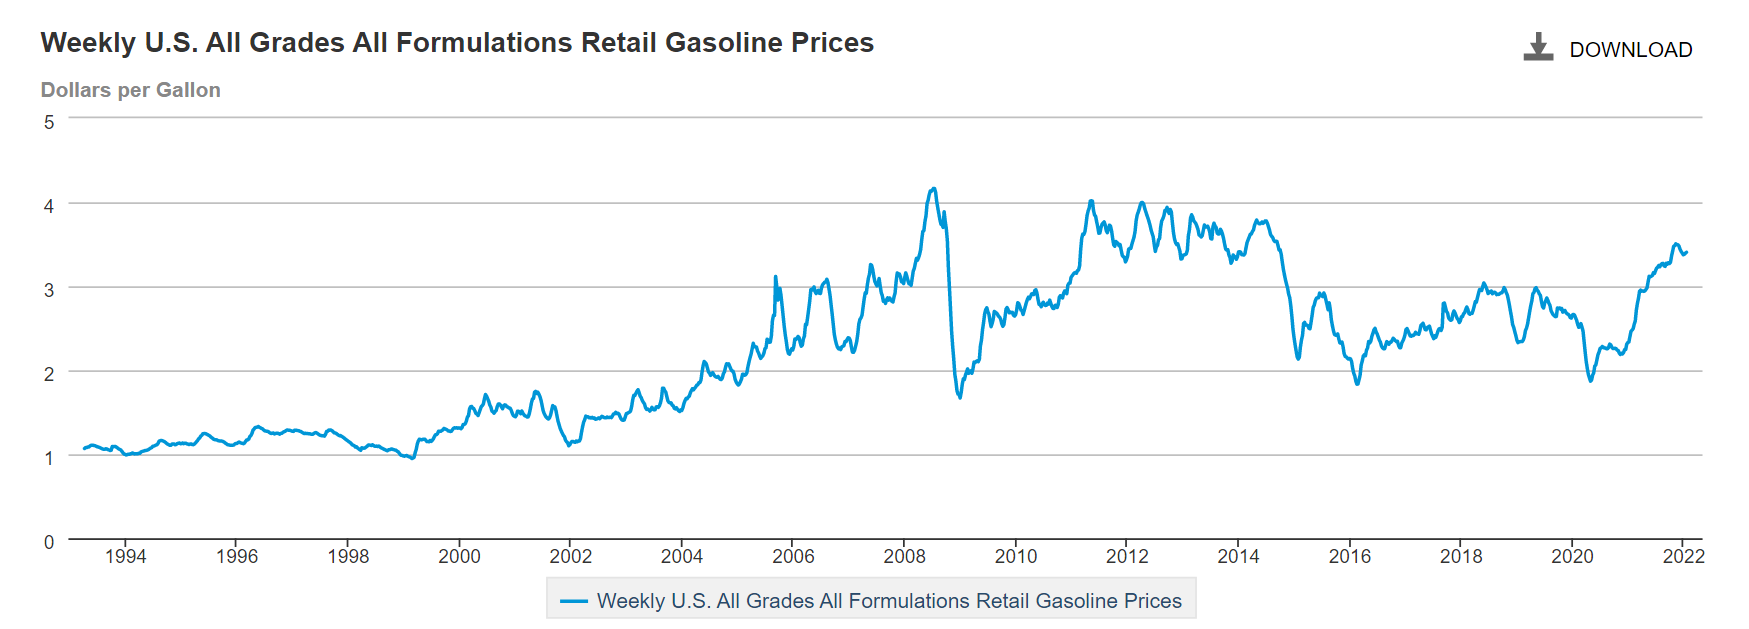
Gasoline prices
And gas prices are coming down a bit. Anecdotally, here in Northern Florida, I've noticed the price of gasoline come down about $0.20 /gal the last couple of weeks.
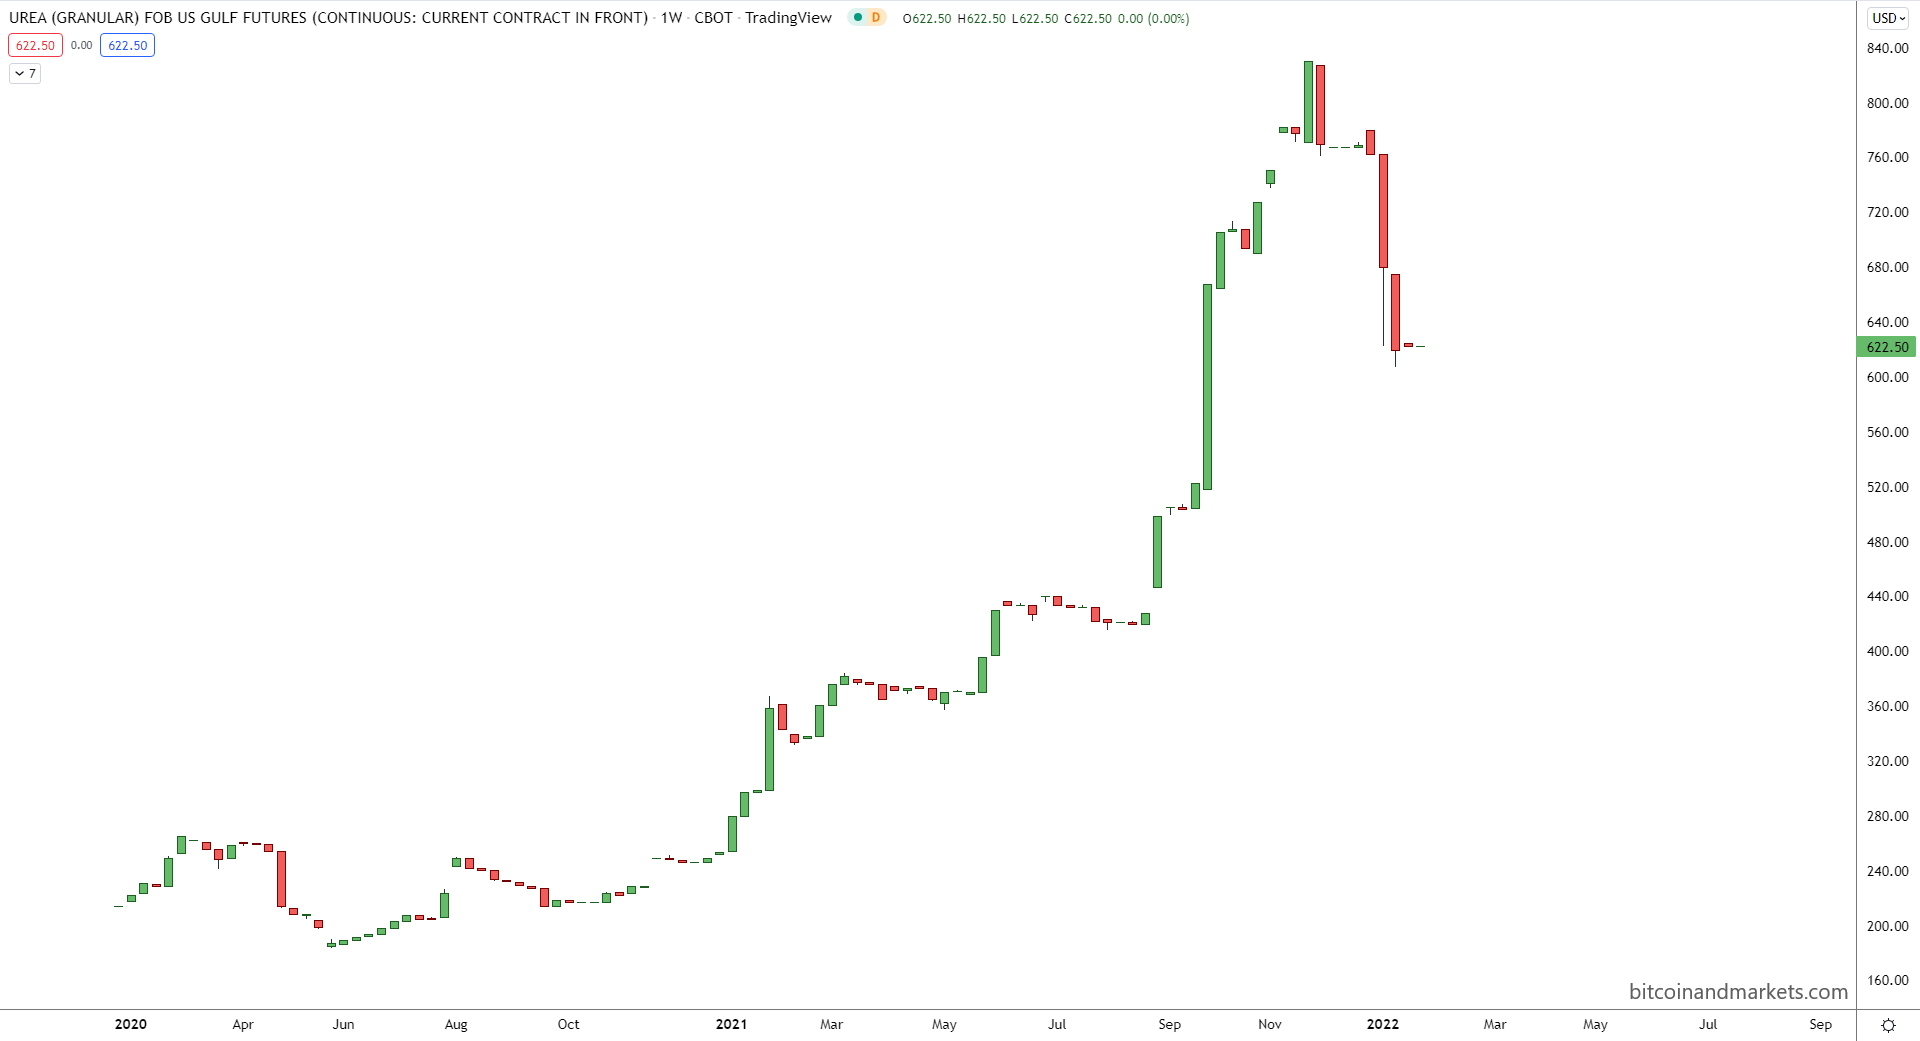
Fertilizer
Here is a new chart. Natural gas is a key component in many things, one of the most important is fertilizer. Many parts of the world are dependent on fertilizer to even grow crops at all. High prices of fert would severely handicap crop yields in many regions.
In recent weeks, we've seen the price of urea a principle ingredient in fertilizer explode in price. This is a very bad thing, because global food prices will likely also continue higher, well into next year. This is not money printing though! High food prices lead to civil unrest, which isn't good for business either.
Prices nearly tripled in the US. The charts from around the world are similar, the only difference being a little less relief in the last couple of weeks elsewhere in the world.
Interest Rates
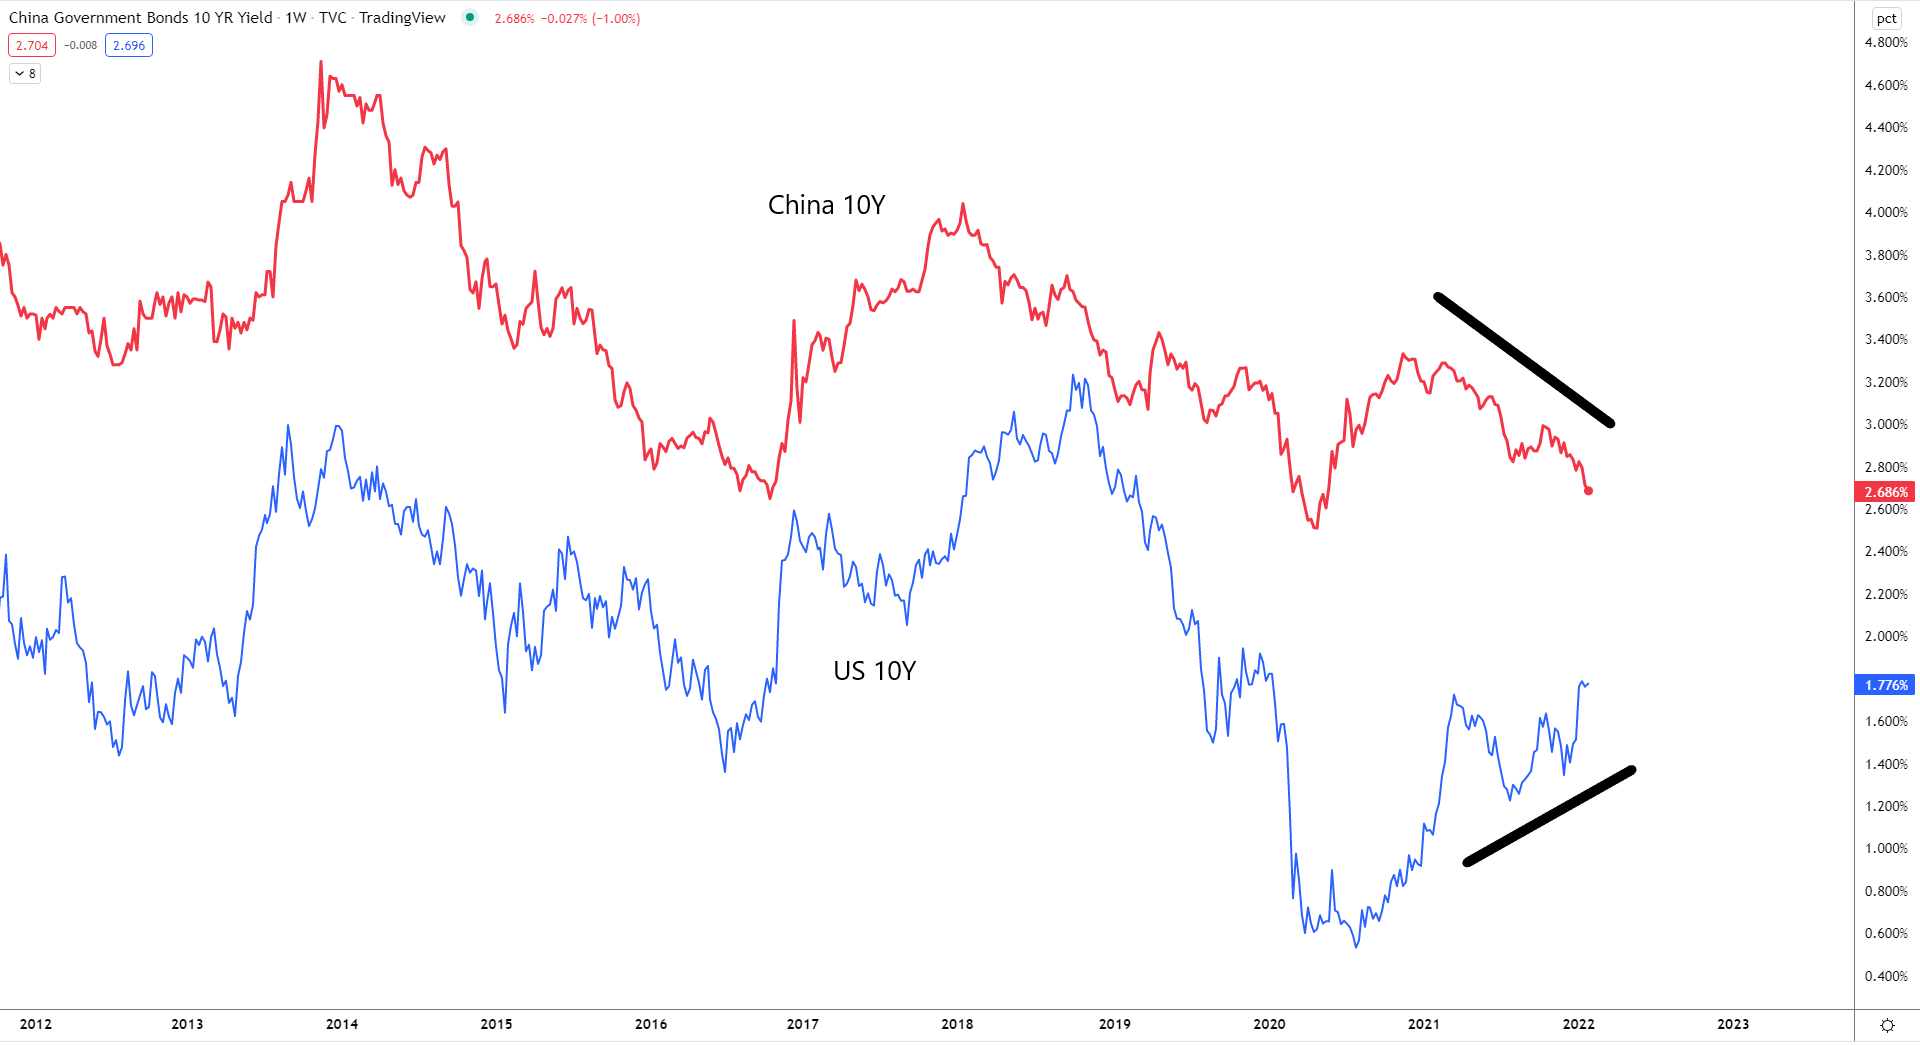
The first chart for interest rates is very interesting. For most of the last decade, US and Chinese 10Y rates have been very correlated. Until recently that is.
The Chinese 10Y rate is headed downward pretty aggressively, while the US 10Y is trying to go higher. This did happen as well back in 2018 you see on the chart. Back then, China was heading down (signaling economic struggles) and the US 10Y continued up for most of the year, until it peaked in October and headed down hard. I expect the same thing to happen, with the US 10Y catching down to the trend in the Chinese 10Y.
Low rates mean there is nothing better to invest in than USTs. All along, long term yields haven't bought the inflation narrative. They were right, of course.
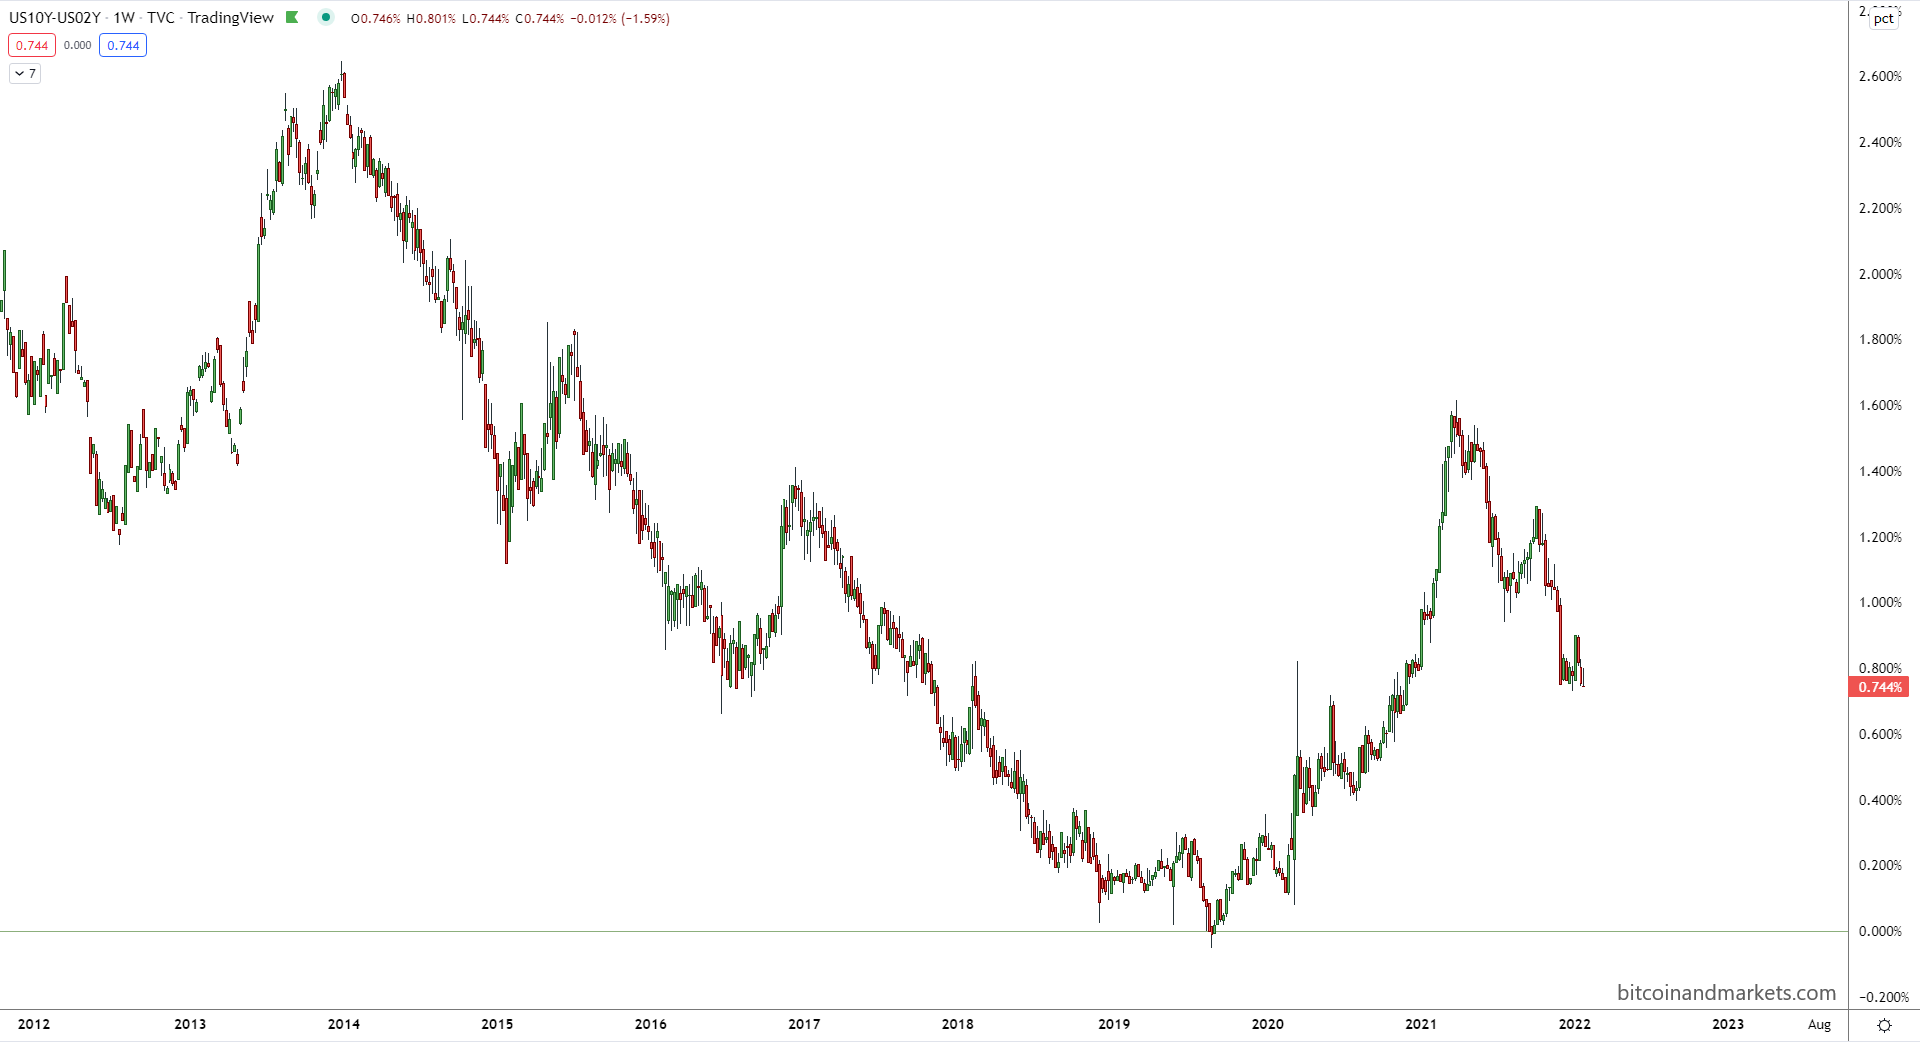
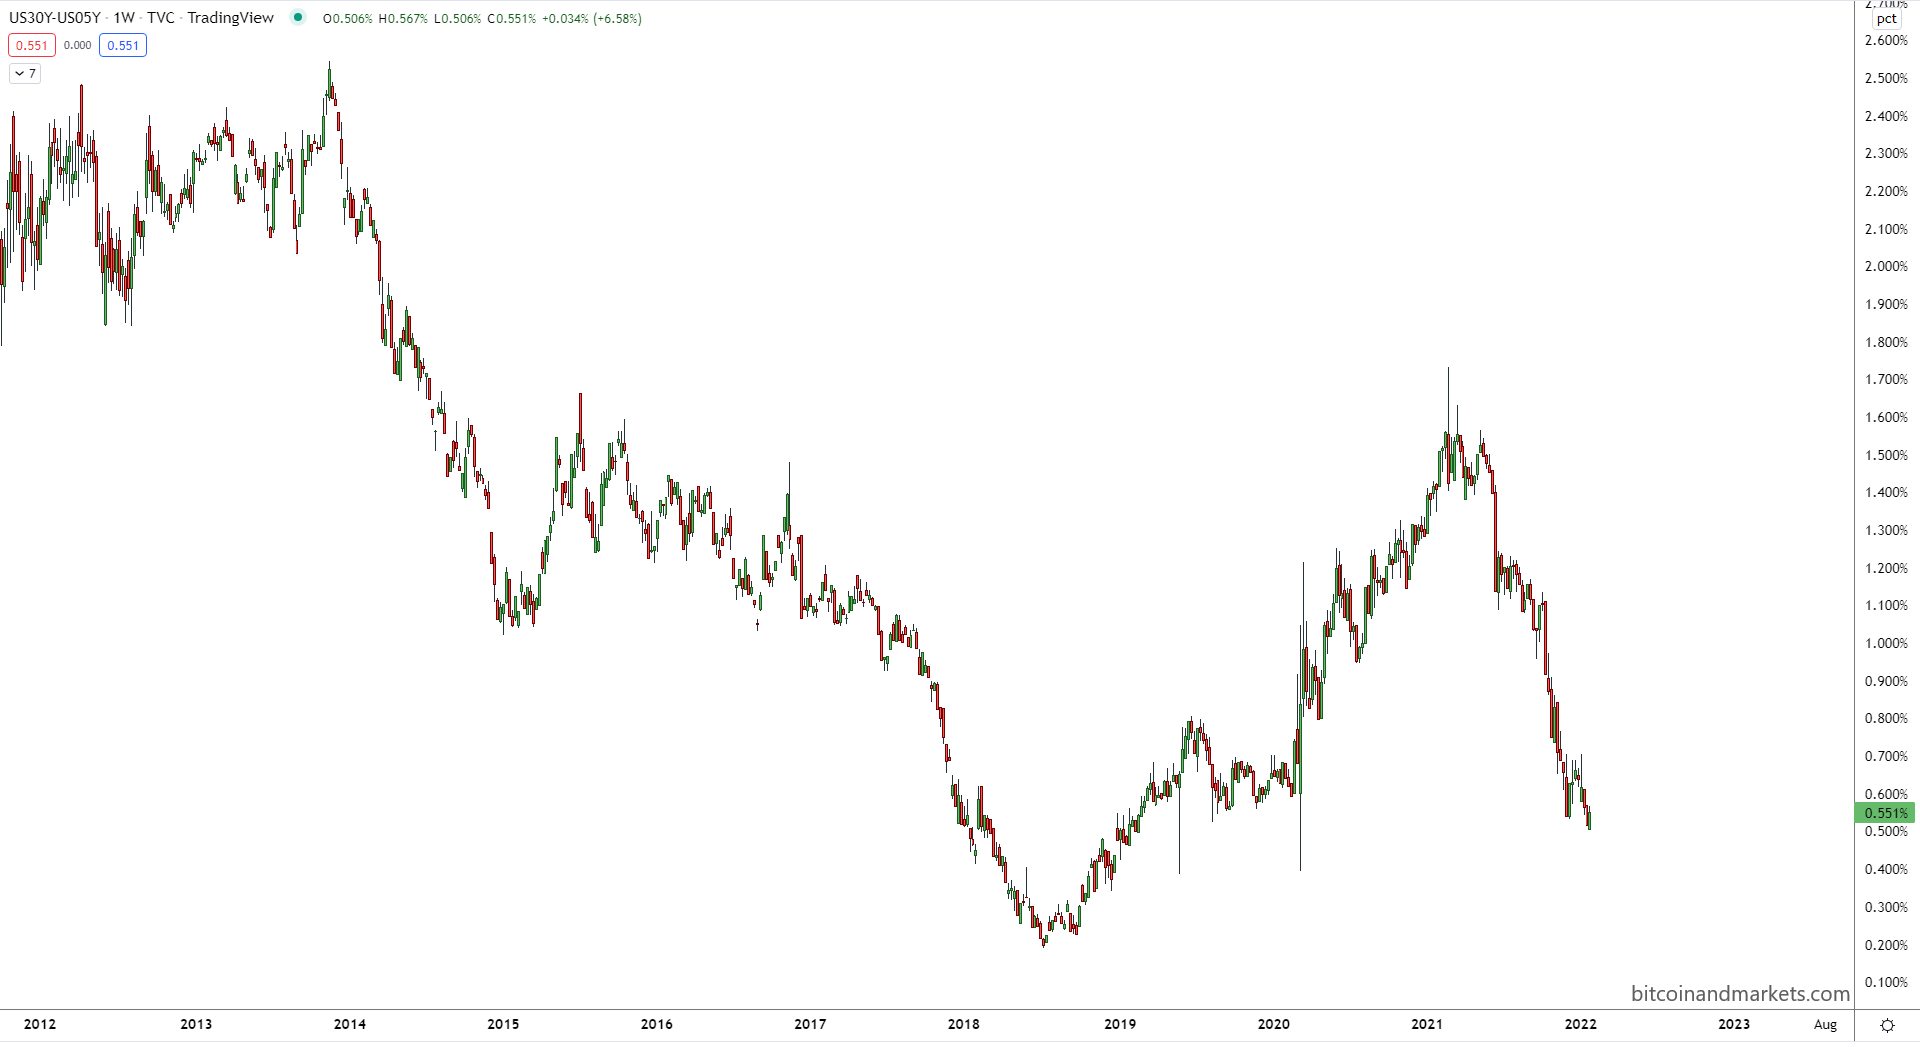
Yield Curve
The yield curve continues to flatten, showing something is not right with the growth/inflation narrative. In a real recovery, the yield curve would steepen, then become relatively flat again at a higher level. That is not happening, it is flattening once again at at a lower level. This confirms stagnation, not stagflation.
We can see it in the traditional 10Y-2Y.
And in the 30Y-5Y. This one is arguably worse, below any technical support and very close to the 2020 lows.
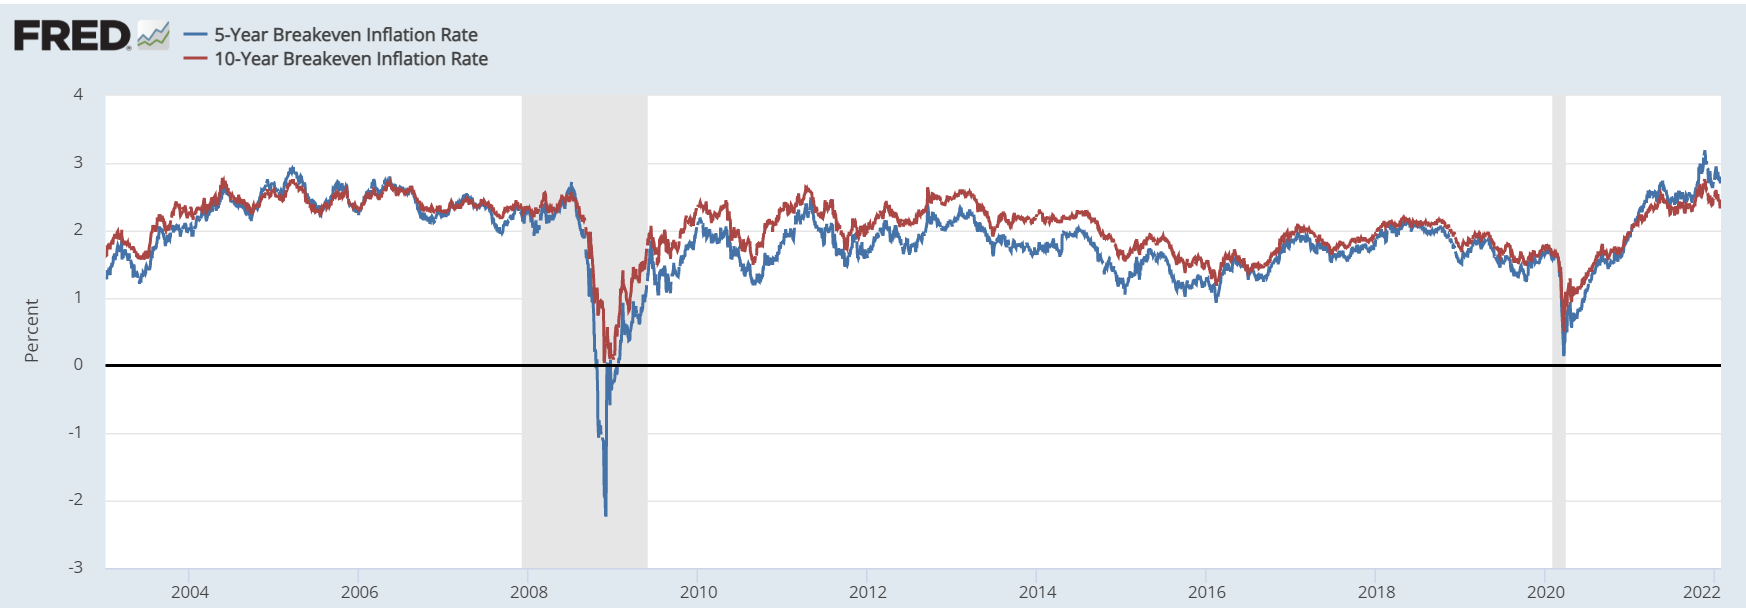
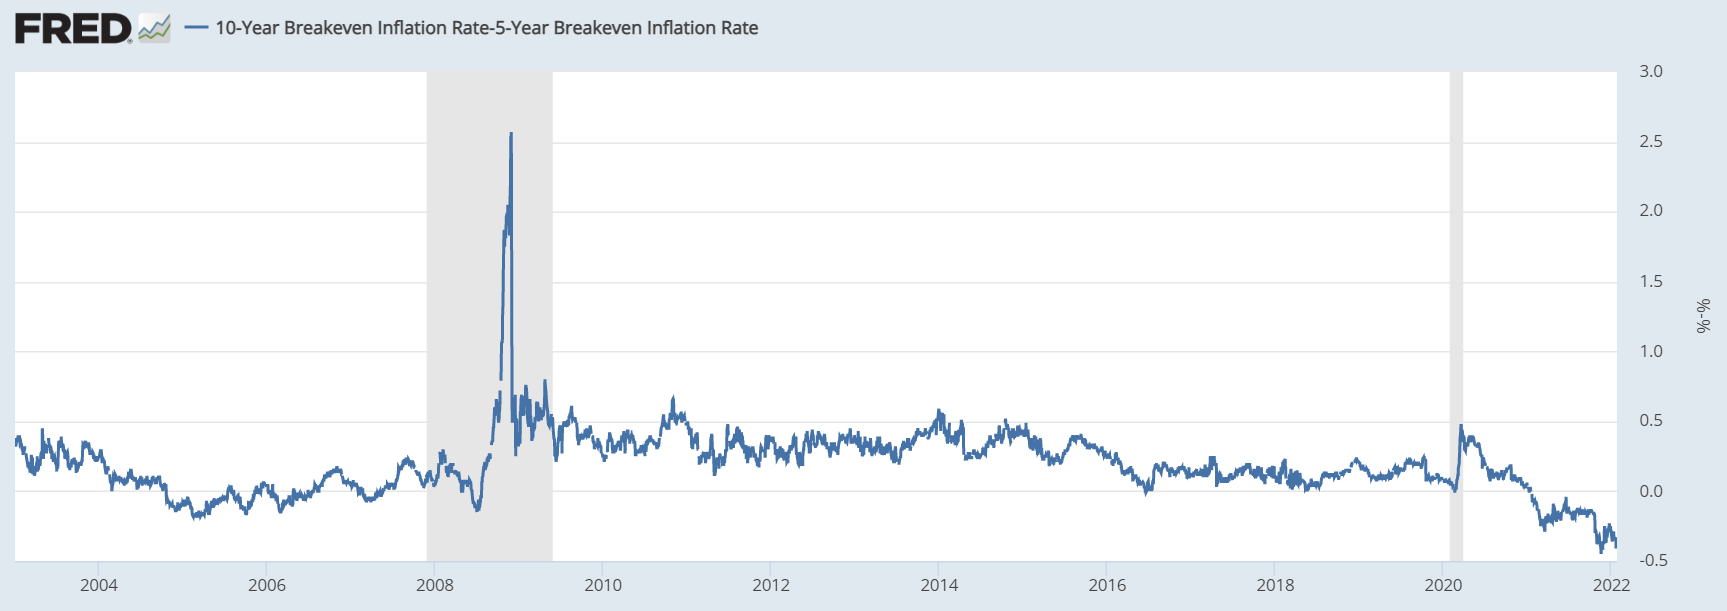
Breakevens
The breakeven inversion is still going strong. The first chart is a straight comparison, and you can see, the current relationship is upside-down. The second one is nasty, showing the amount of inversion as worse than any time leading up to the GFC or during. This should be a flashing red light that something is very broken in the economy.
Inflation expectations
Despite all the fear-mongering about inflation, the gold standard for inflation expectations, 5Y 5Y Forward never got above 2.5%, and is now crashing below 2%.
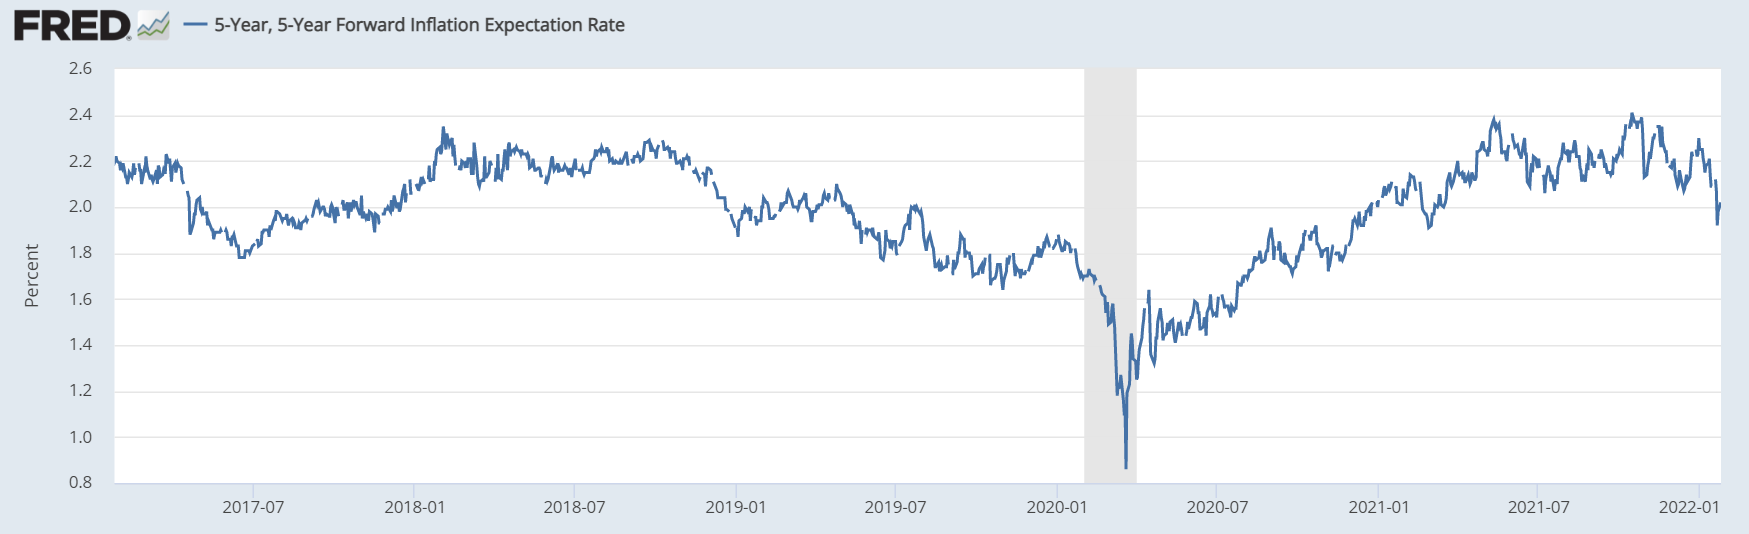
The market is probably more correct than some pundit on TV that has, by the way, been wrong every time. The gold bugs have been wrong the whole time.
I get the idea of negative interest rates, interest rates are below inflation. But does that make sense for the most liquid, sophisticated market in the world? No.
To explain this away, people blame QE as the Fed keeping interest rates down. There is very little evidence of that. In fact, there is contrary evidence that interest rates move long before the Fed changes policy, almost as if, in a game of follow the leader, the Fed follows but takes credit for being the leader.
I don't like the idea of negative real yields that last longer than the briefest flashes. The real explanation of negative real rates is the CPI. CPI measures prices not money printing. Many things can make prices increase, like uh hum, supply chain back ups.
Dollar (DXY)
The dollar bounced beautifully off support and is heading back up. We'll see how it trades over the next month as the inflation narrative is squashed.
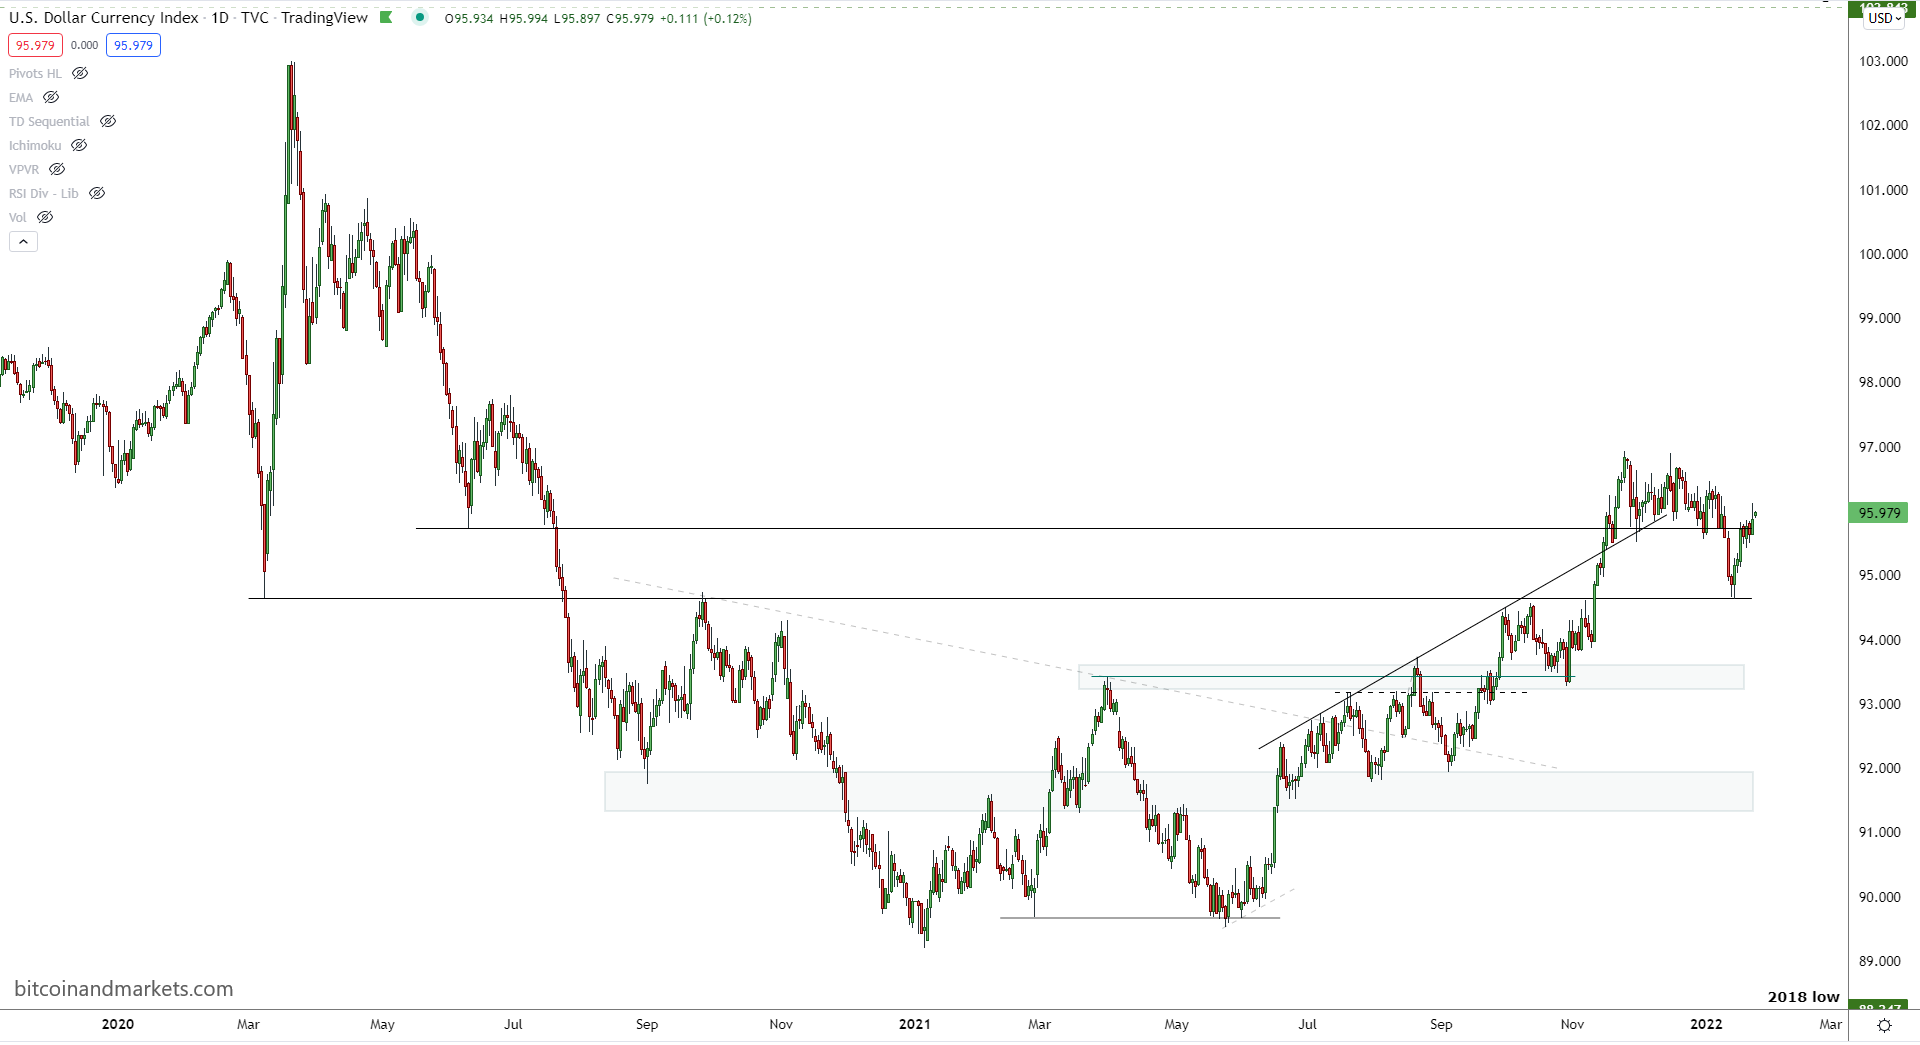
A lot of the dollar story is going to be similar to the energy story. If Europe gets hit with a Russian incursion, the Euro might face some weakness. The Fed is messed up, but put yourself in the ECB's shoes. They might have to face this down turn with full QE going, and with energy prices rising. Wow, there's not help for them.
If that is the case, I expect capital to flee to the US. This will lead to a dollar rally, and a stock rally. As bears look on in disbelief.
Freight Rates
A quick update on the Baltic Dry Index for you. This is the cost for a container of dry goods on large container ships. As you can see, there was the huge spike that peaked in the first week of Oct, but has been plummeting. This price movement tells me that a lot of the supply chain issues, at least on the container ship side, is getting figured out.
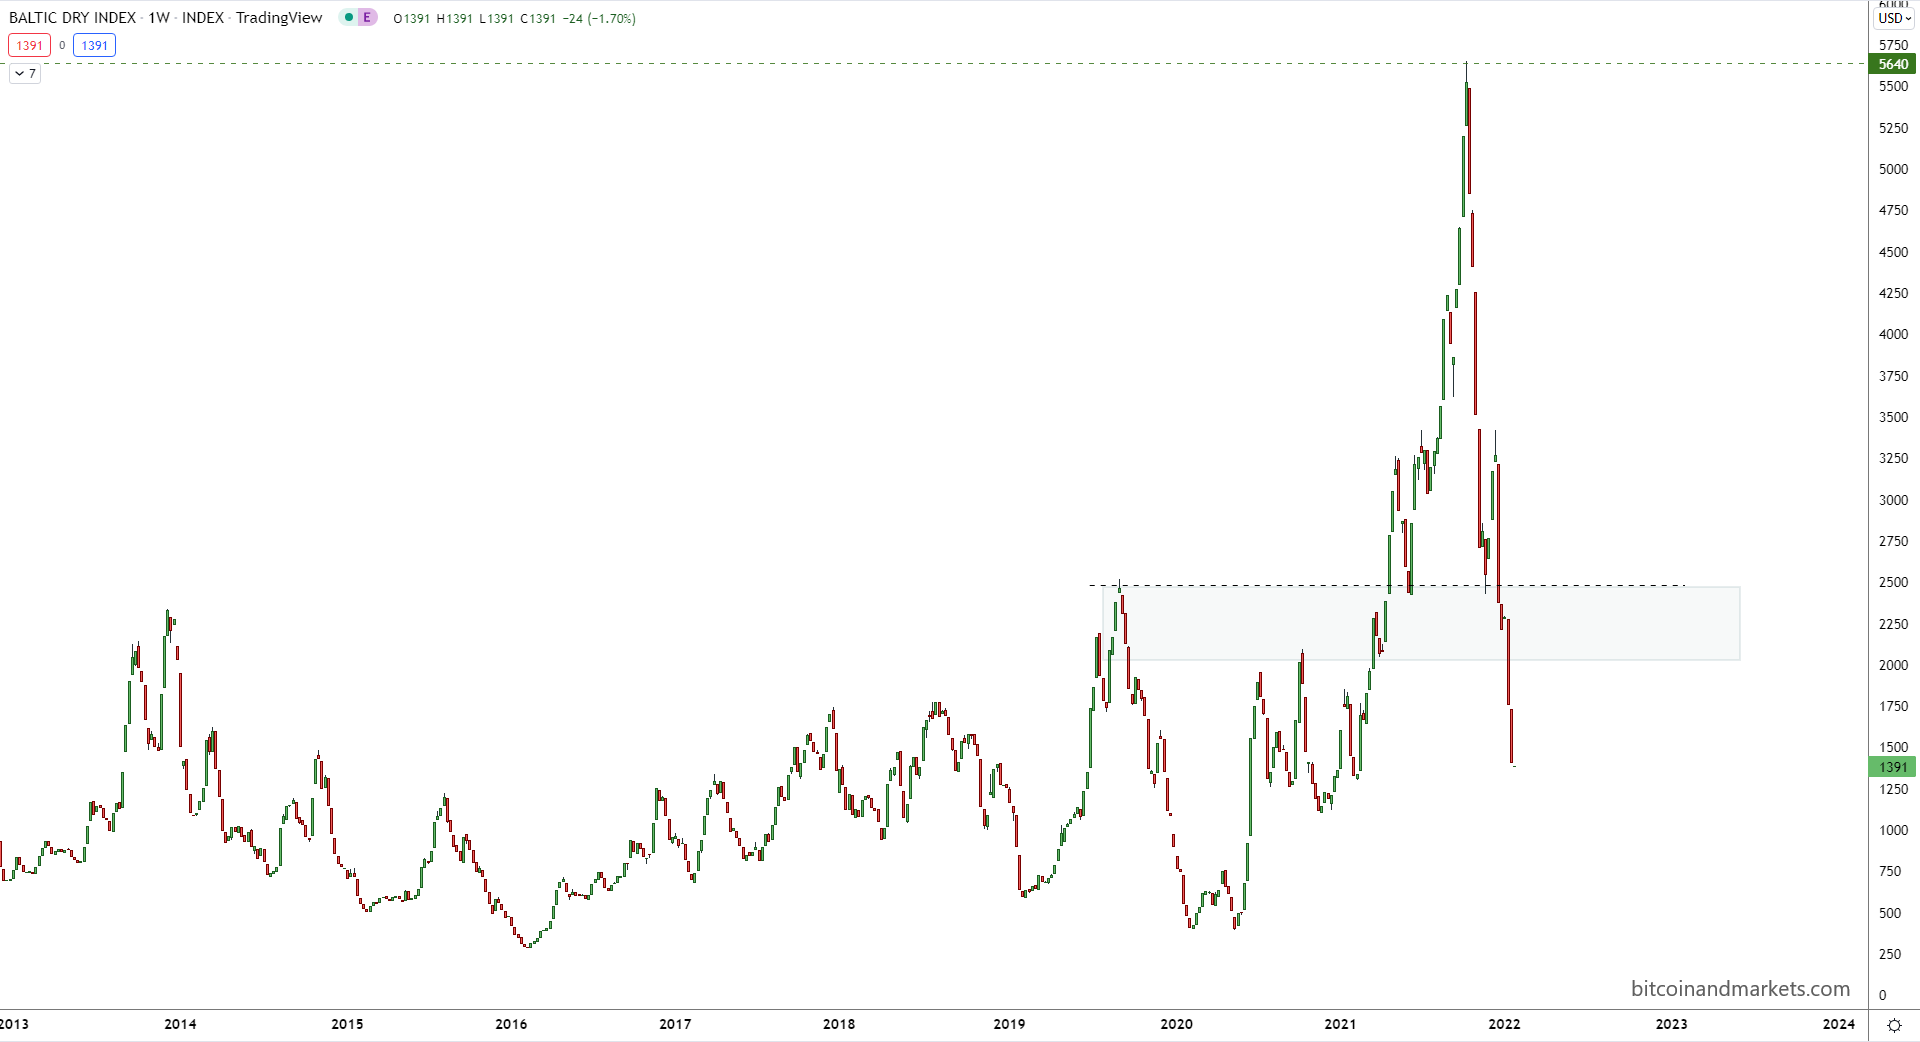
I also worry that it could mean the economy is in free fall, and we just haven't noticed it yet. Businesses double and triple ordered during the run up, just to make sure they got merchandise before Christmas. Now they have inventory, and less reason to order, so order numbers have likely crashed very low.
That's where I'm going to leave it for this issue. Questions or comments, reach out on twitter to @AnselLindner.