Macro Chart Rundown - 8 Nov 2021
In this post, I examine oil and natural gas prices, show the energy crisis in charts, discuss the dollar, and global shipping container rates.

If you like this content, SUBSCIBE and SHARE! Thank you.
In this post:
- Oil and natural gas - energy crisis in charts
- Dollar
- Shipping container rates
Energy
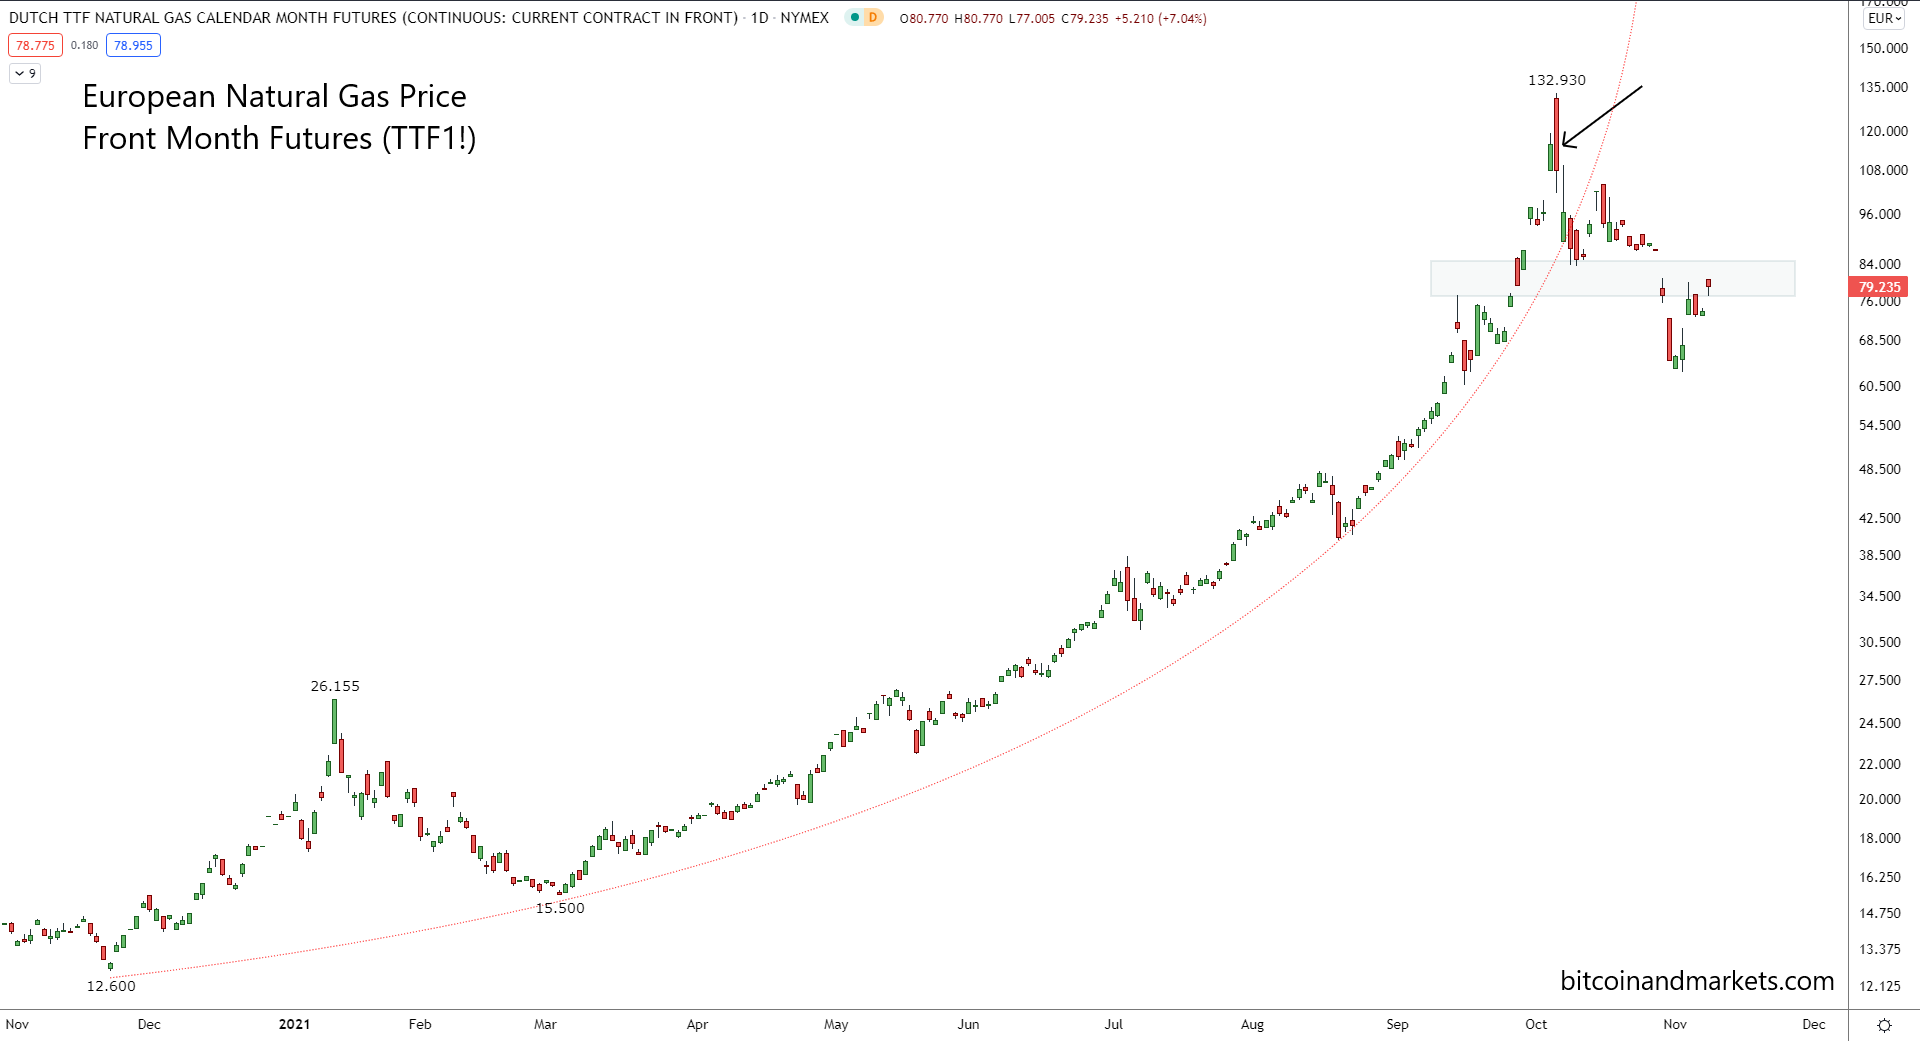
Let's begin with an update on the Natural Gas issues in Europe and the US. Last Macro Rundown gas prices in Europe were spiking. The chart I showed was the actual day of the top.
It is very dangerous to trade this chart because it could double again with a couple days, or could reverse from right here. [...]
The price will come back down guaranteed, but when that will be is the hard part to predict. It will take a year or two, but prices will get back to €20 again.
I might have been too generous with the time, at this rate it won't take a year or two. Prices are now back to €75, down 43% from the high. We could see "normal" prices around €20 by next summer. June and July 2022 futures never broke €50, and are around €40 today, signaling even the experts don't think price will stay this high for long.
The crisis is not necessarily over, but the first panic stage is. I expect Europe to struggle with energy for years to come.
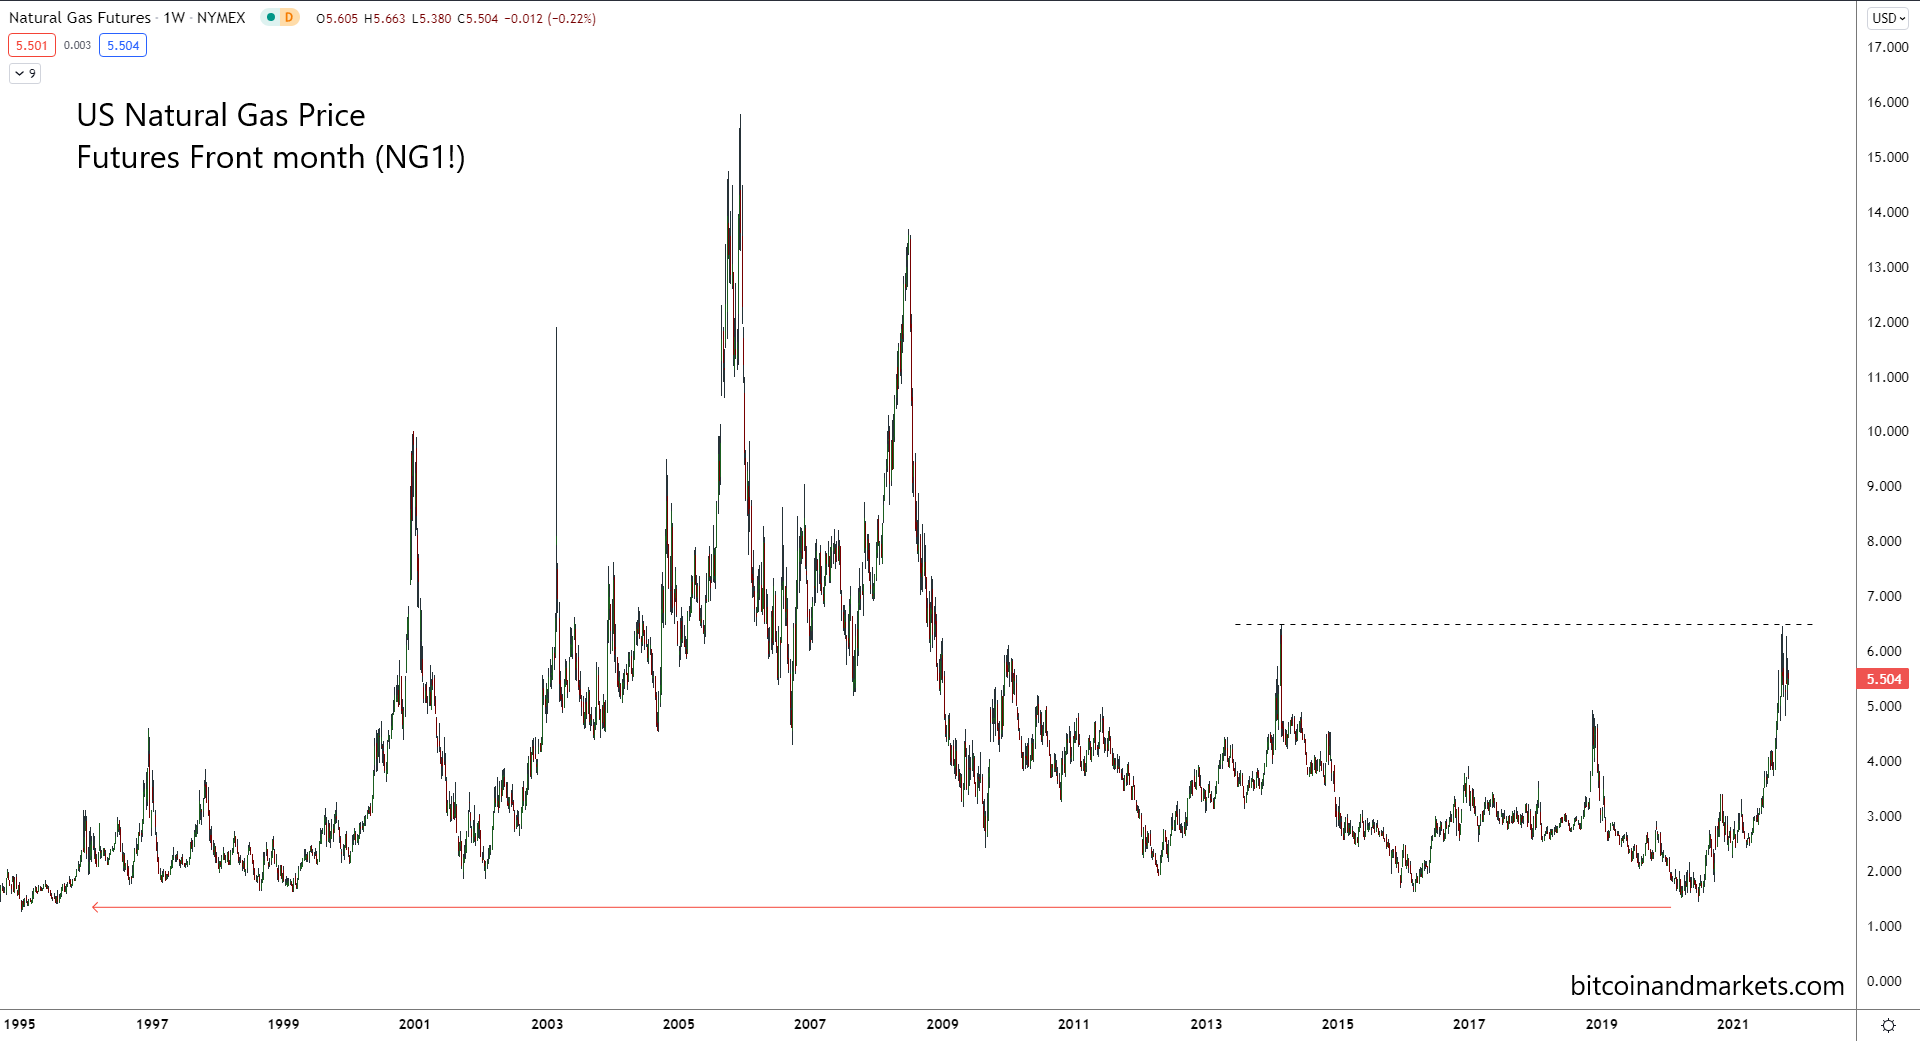
US Nat Gas Price
US natural gas price has been very tame relative to Europe. Prices touched $6.46 but are back down to $5.5 now.
US natural gas will tend to be much more stable due to the US being an exporter, which we've seen. Here is a long term chart that is a great example of inflation scare. In 2020, US natural gas hit a 25 YEAR LOW! The lowest since July 1995. When this recent rally is put in perspective of the last 20 years, prices at the recent spike were just back to a 20 year normal, but are likely unsustainable here.
There is simply no rising demand. This is all the effects of a destructive supply shock that will have deflationary consequences.
Oil
As you may have read, Poopy-pants Biden attempted to get OPEC+ to increase energy production and was kind of laughed at. Many people thought this request was in the sole interest of the US and oil prices here; no, not at all. US oil prices are up, but not historically high; US gasoline prices are not at record highs; US natural gas prices (above) are not that high either.
If not for the US then who was it for? Glad you asked. It's for Europe.
The US has started to pivot hard away from old-man Europe, leaving them at the mercy of Russia for energy. The EU's muscle (the US) is going toward AUKUS away from NATO, and it's my opinion that Biden asked this of OPEC in a half-hearted attempt to help the former NATO allies.
The US is energy "secure". I don't say energy "independent" because they technically aren't right now, but the US could easily be energy independent within the next year if push comes to shove.
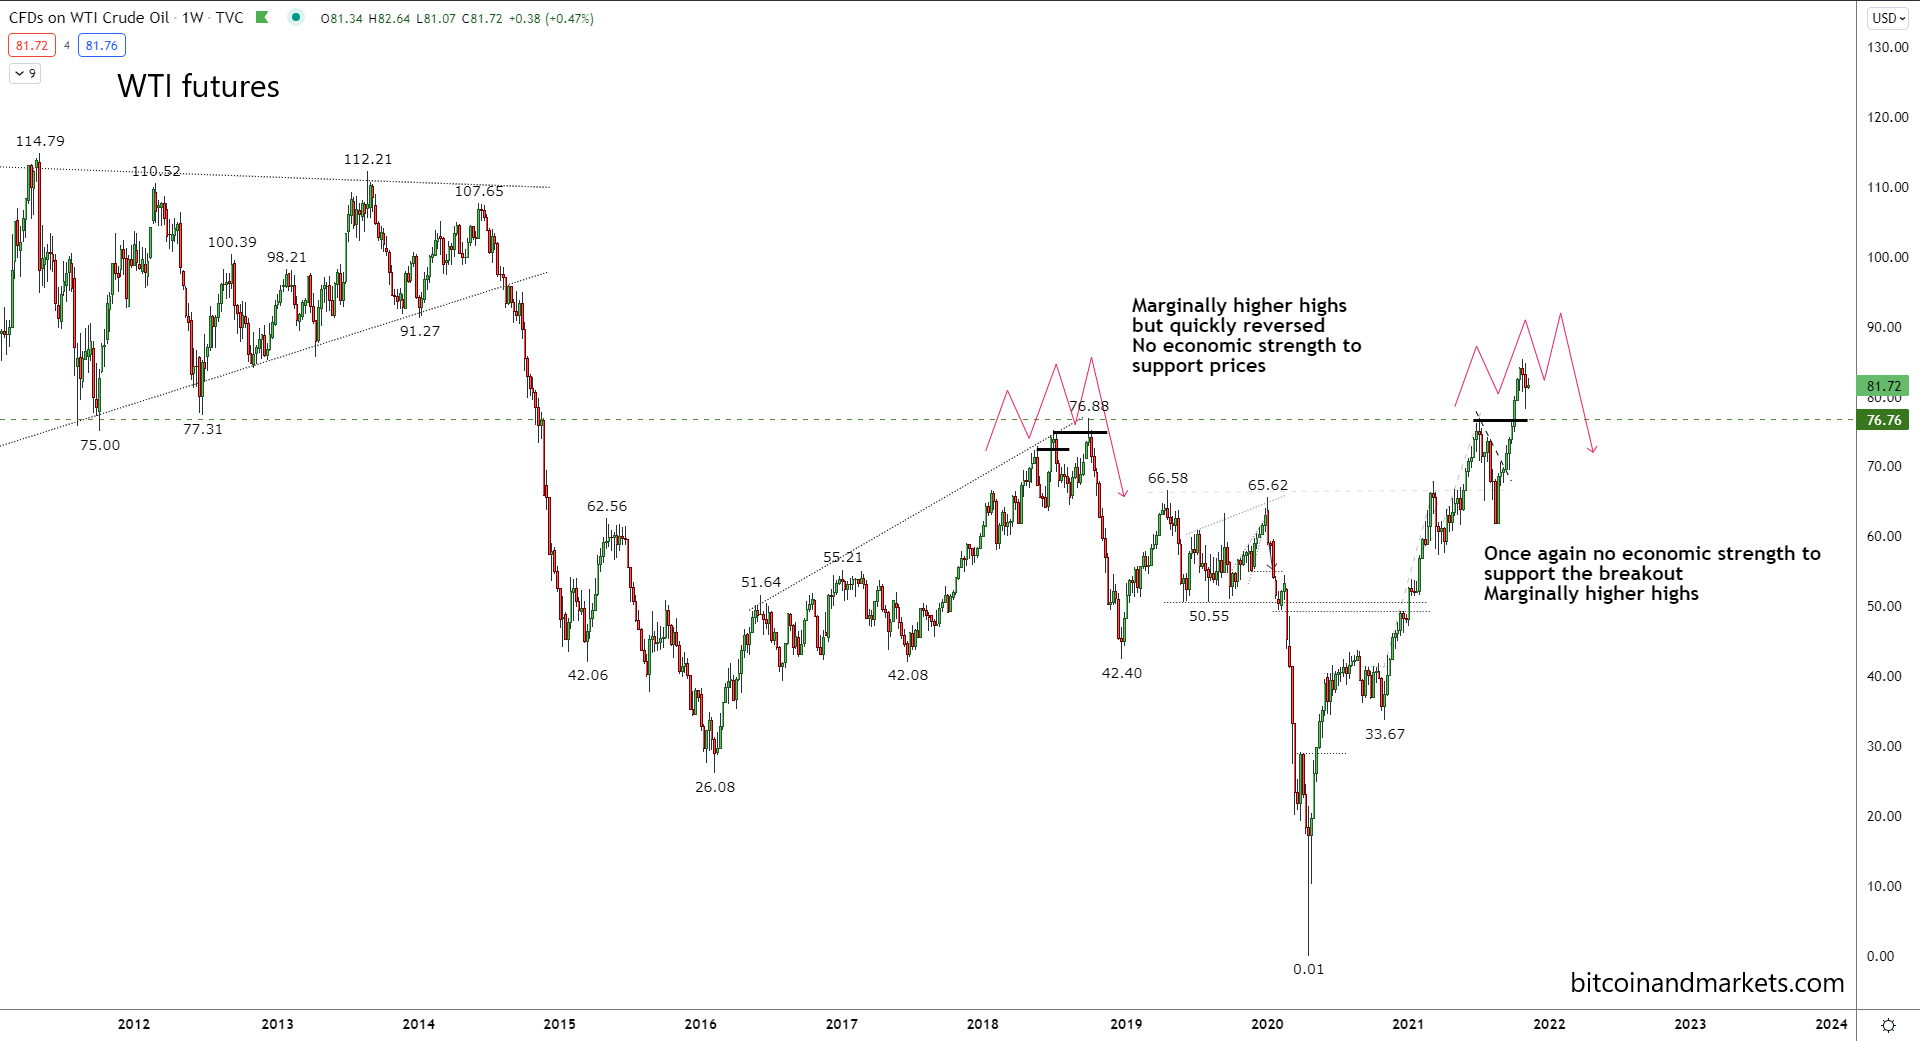
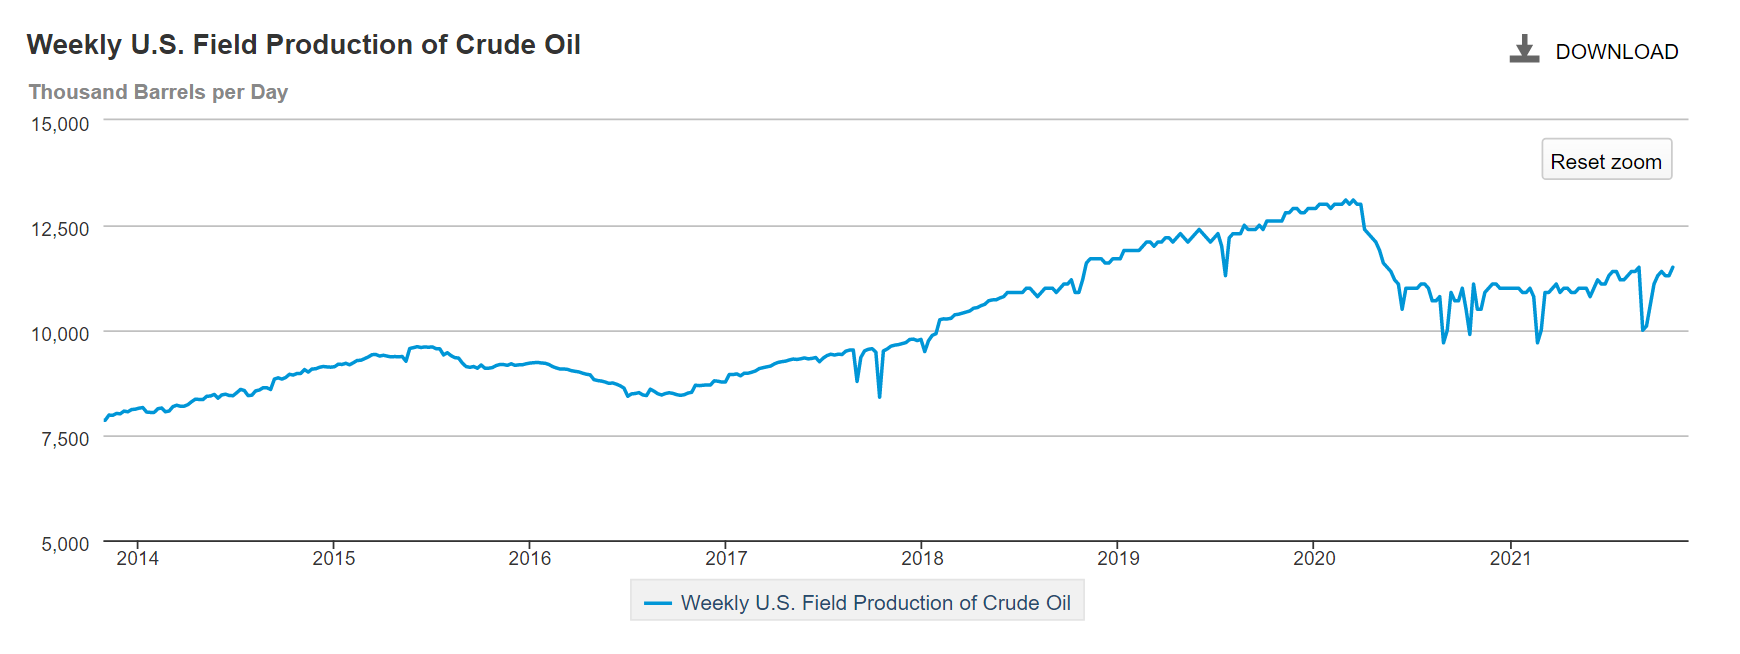
Current 0il prices in the $70s and $80s are very profitable for US producers. Stories are starting to come out that some US producers are even setting production caps at current levels in order to reap high profits. If they pumped more, prices would come down. Despite this, more production is still trickling back online, up to 11.5 million barrels/day last week.
US Oil Production
Gas Prices
Anecdotally, in Florida, gas prices hit $3.29/gal last month and since were back at $3.09 and now $3.19. Much higher than last year, but not the $4 we often saw 10 years ago.
The data say the same thing. The national average is $3.48, barely getting in the range of 2011-2014.
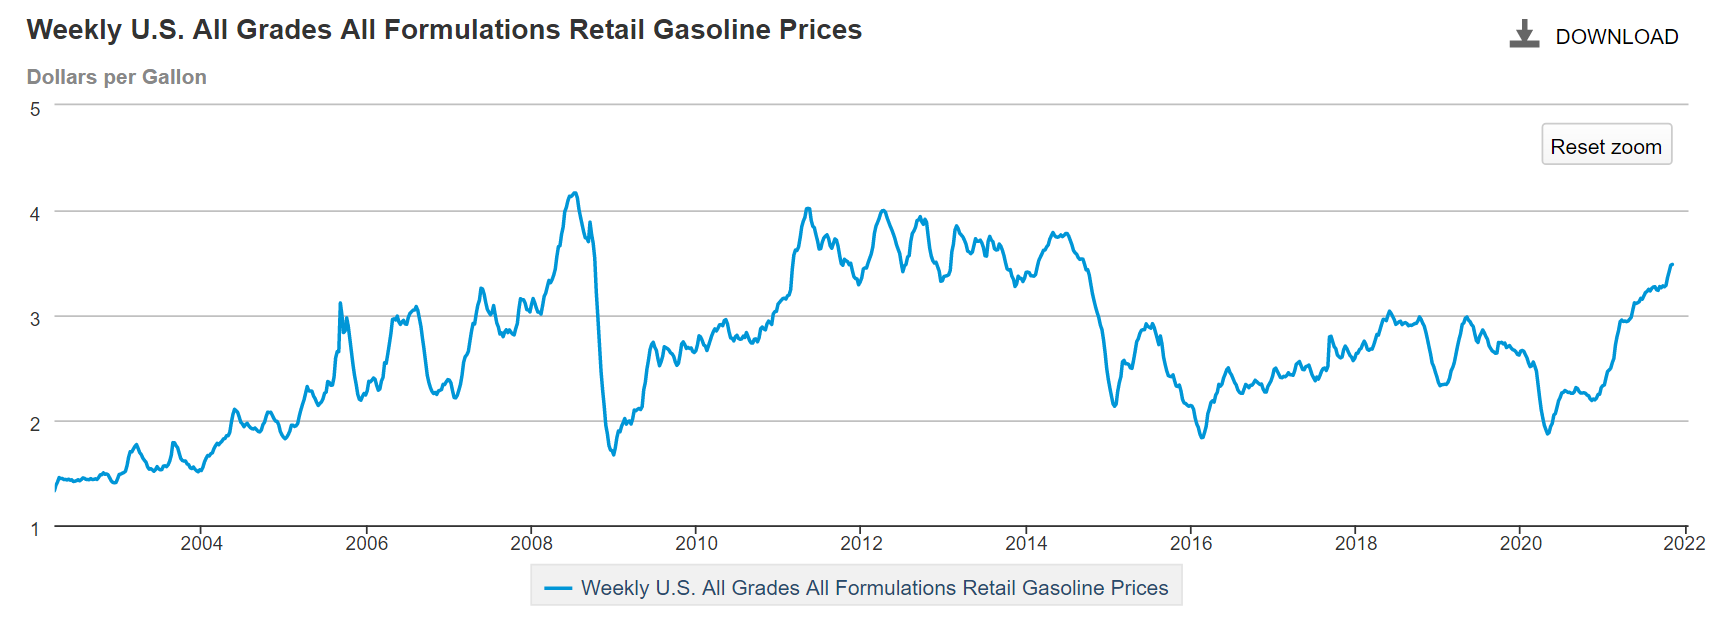
With oil production creeping up and demand stalling due to supply bottlenecks, mandate layoffs, and an overall bad economy, demand should drop significantly in the near-term and gas prices should come down. I maintain that this is not an inflationary spiral, and that oil prices continue to rise due to fallout from last year's market mayhem.
It is possible that gas continues to $4/gal like in 2008. But also like 2008, it will be followed by a massive drop. I will mention a wildcard possibility for gasoline prices temporarily rising above $4 and that is if the OSHA mandate is struck down in court quickly. It has already been placed on a stay by a Federal judge in the Texas lawsuit, and if it quickly goes to the Supreme Court and gets stopped for good, it could be seen as extremely positive in the short term.
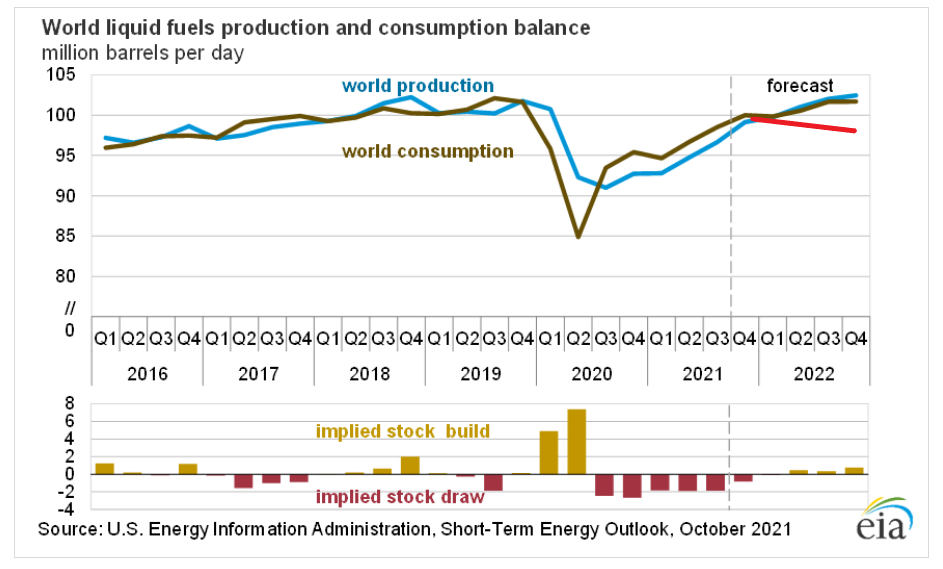
EIA Oil Forecast
The EIA has their own forecast, showing a boring return to a slow upward trend in consumption and production through 2022. I think that is a rosy picture. We will have more economic weakness and lower global consumption in the next 6 months. My prediction for consumption is the red line, leaving an obvious excess in production over consumption. If that is the case, prices can't help but come down.
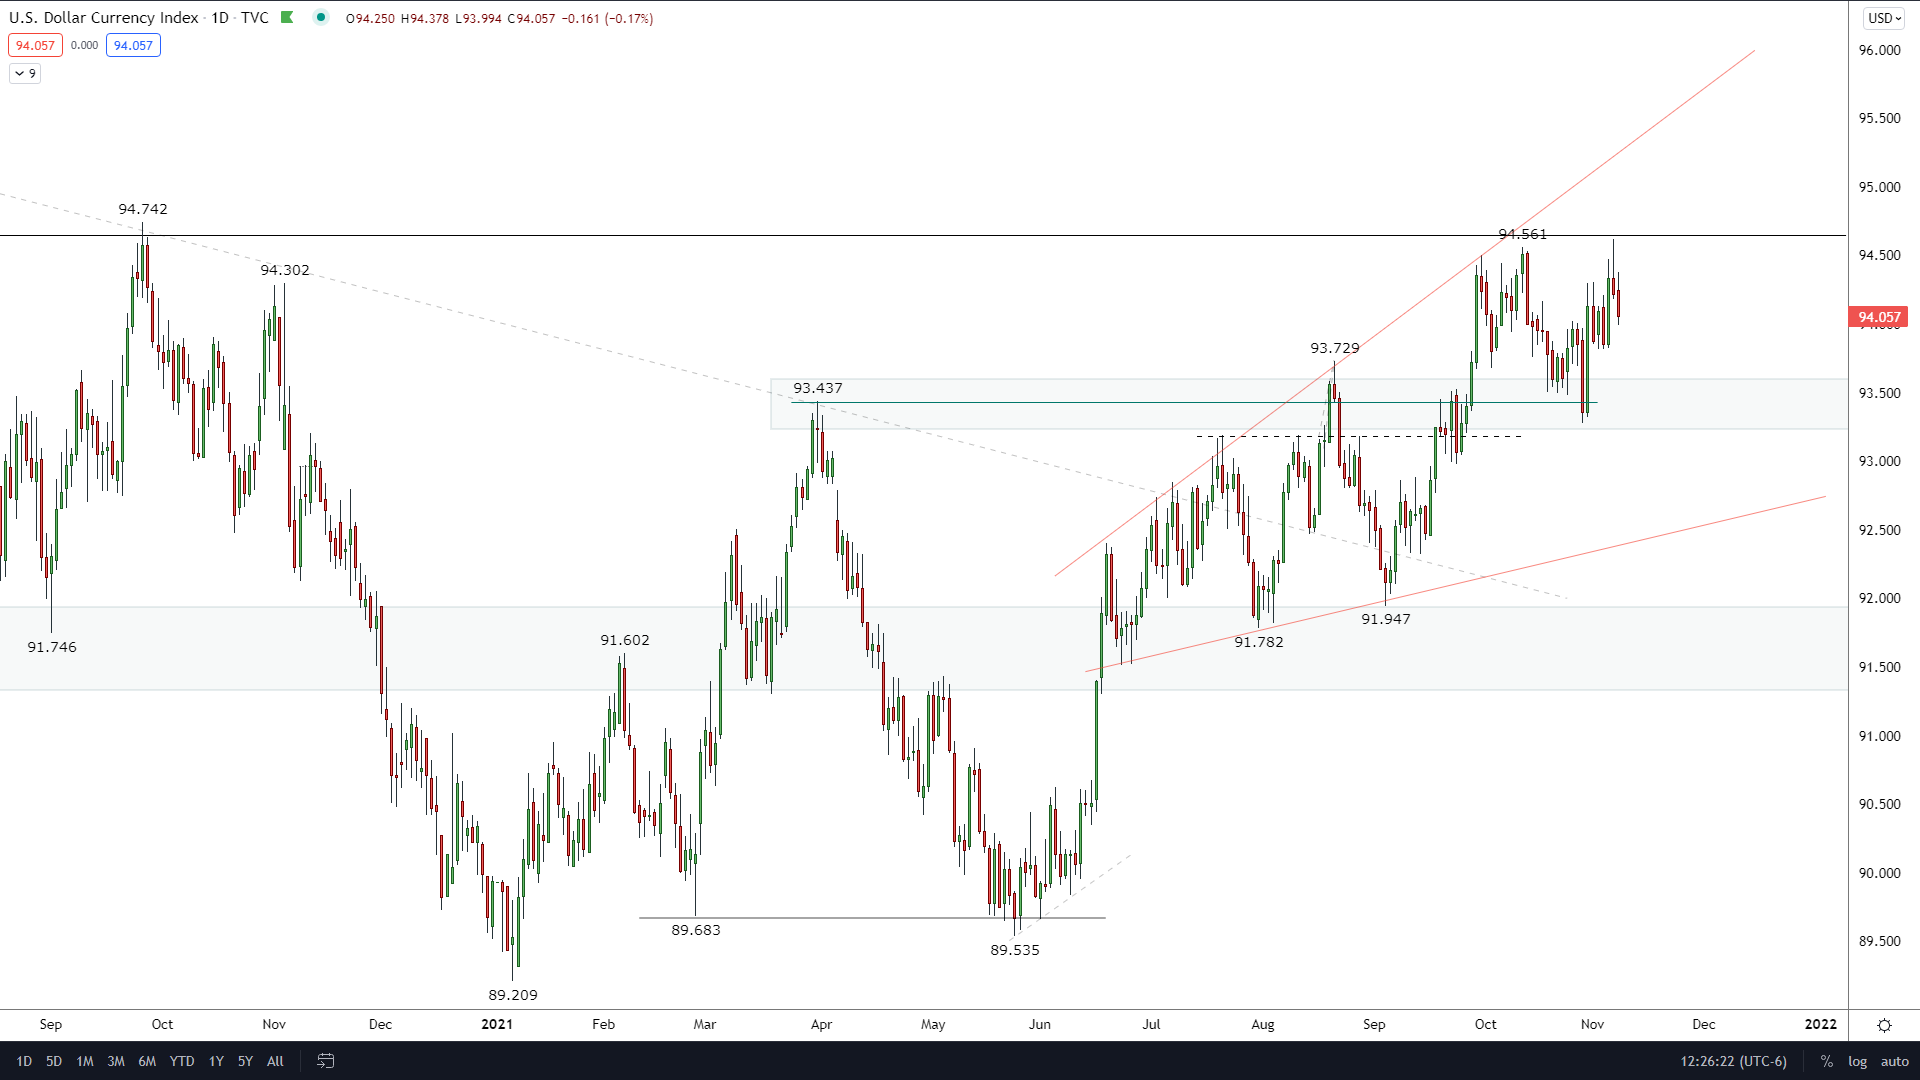
Dollar (DXY)
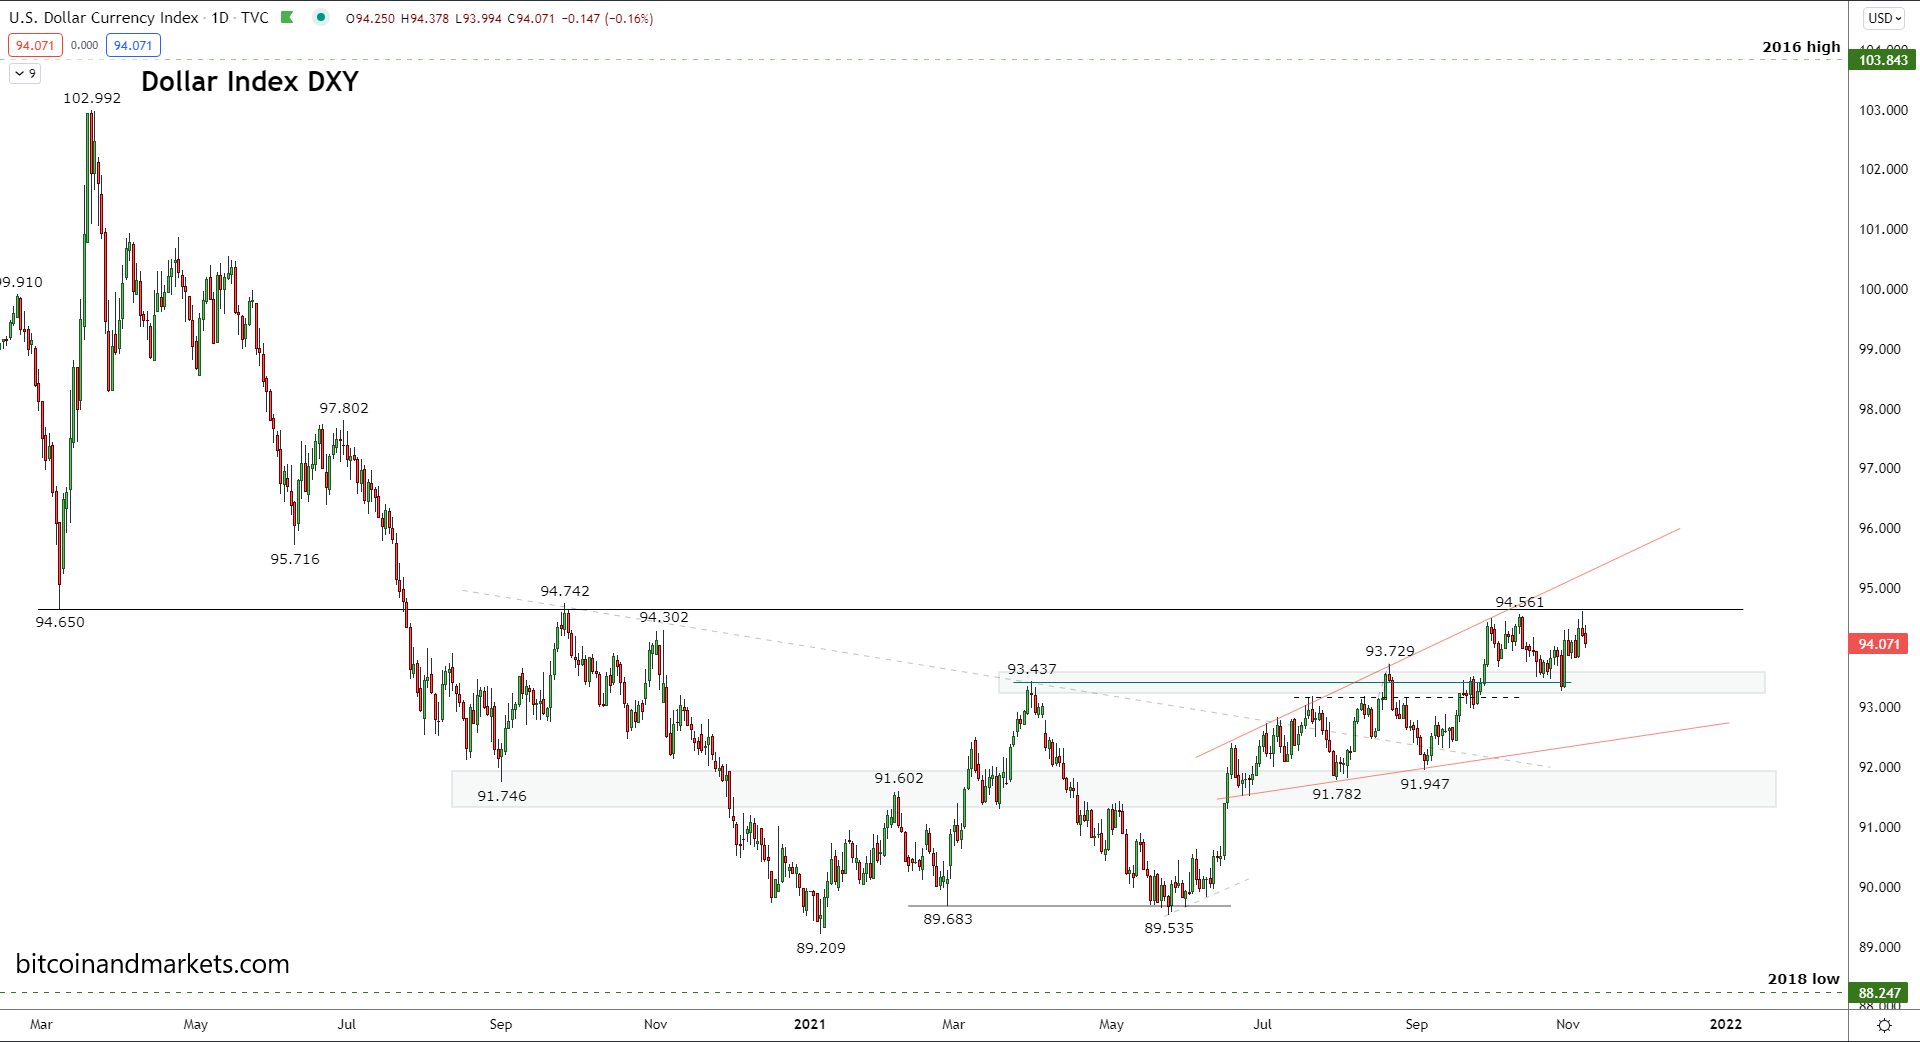
The dollar is attempting to get through this resistance area that was support on the initial covid crash and then resistance for the Sept 2020 bounce. If DXY breaks to new highs, watch out!
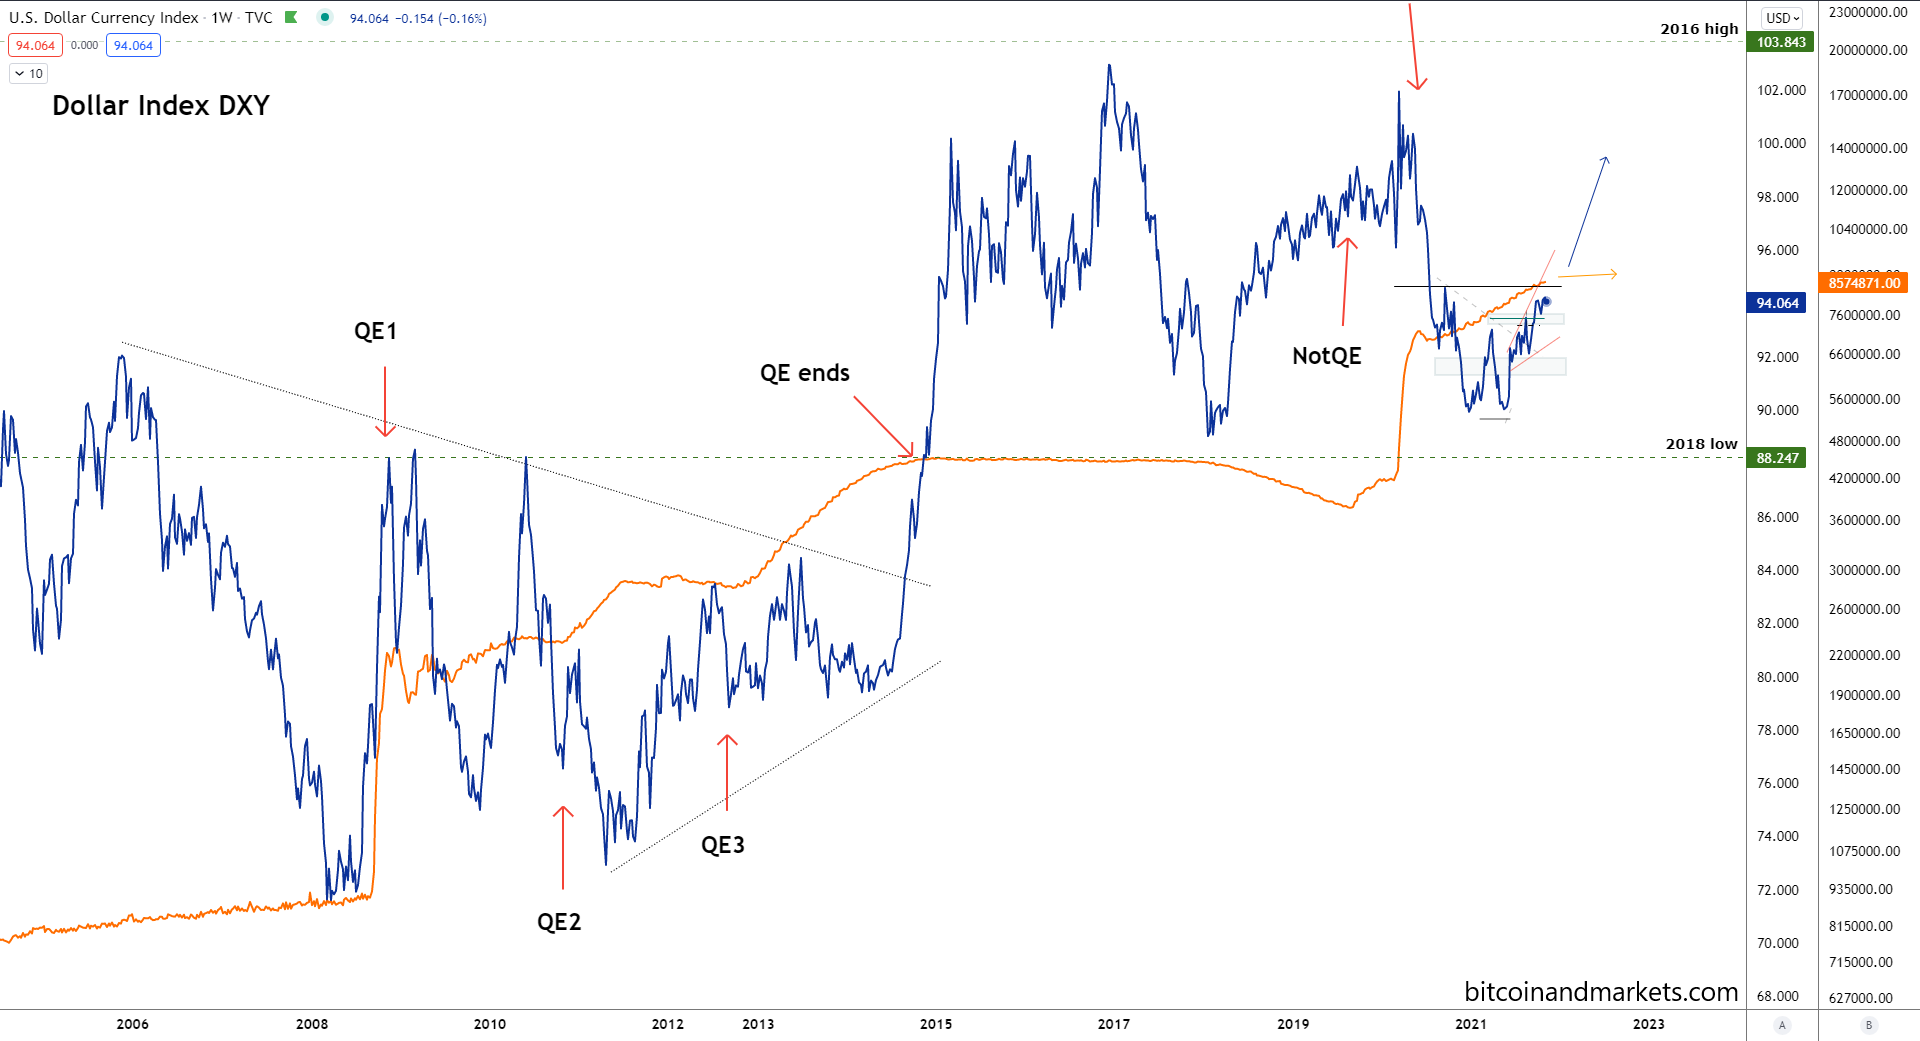
Taper was announced last week by the Fed so I wanted to present a long-term chart that had the Fed's balance sheet along side the DXY dollar index. As you can see, since QE started the USD has strengthened. It's been materially higher since. Also, as QE ended in 2014, the dollar strengthened very quickly.
Keep in mind this is not a causal effect. QE and a rising dollar are both symptoms of financial stress. I don't expect this to be the end of QE.
Inflation Expectations
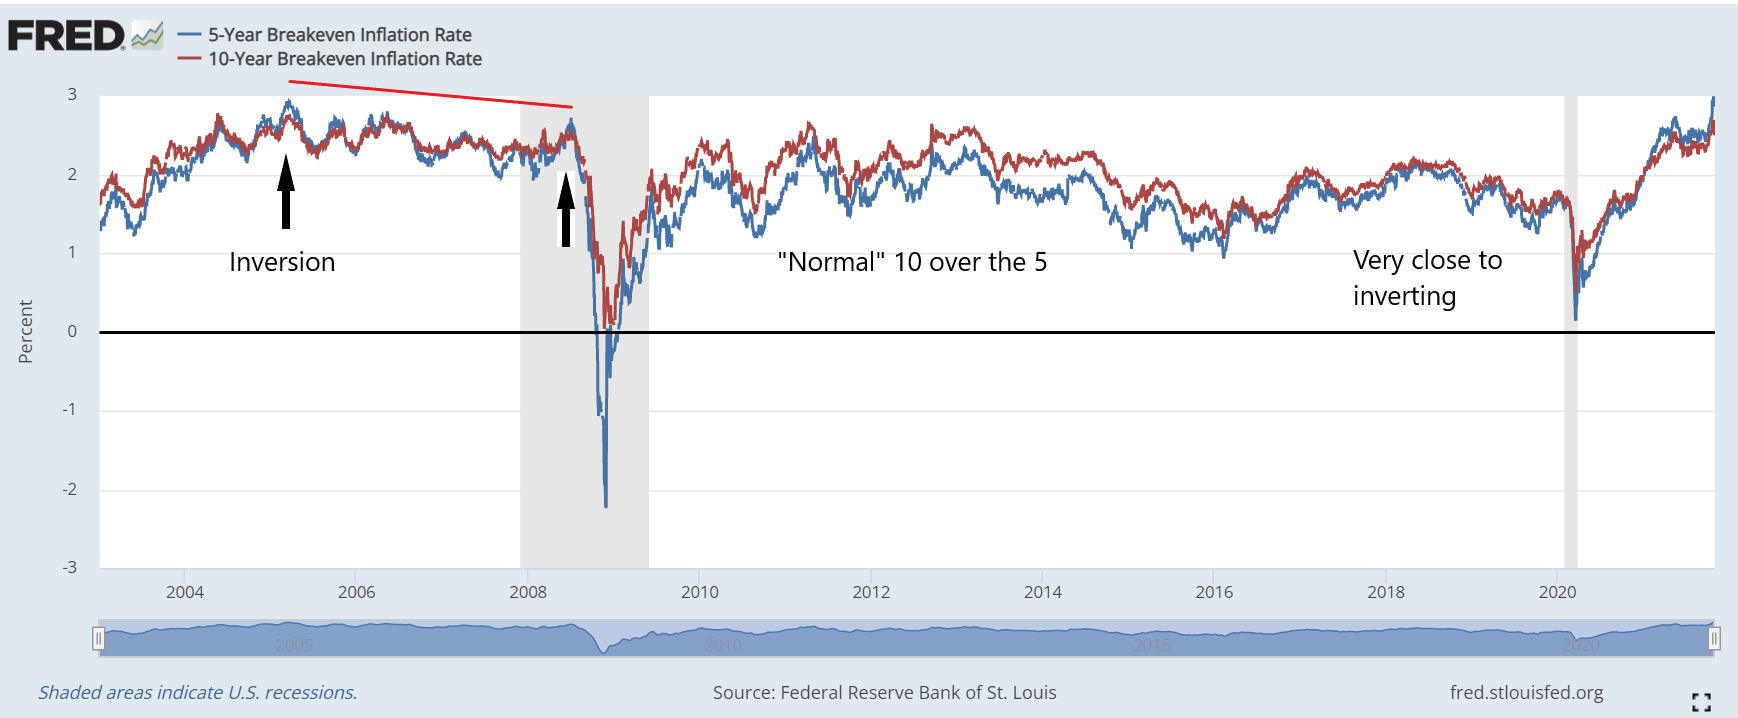
Next for the dollar, I wanted to write a little about inflation expectations and the biggest inversion in breakevens in their history. Breakevens are the difference between non-inflation adjusted Treasuries and inflation adjusted securities. The difference will tell us what the market is expecting for inflation during that timeframe.
There is currently a massive inversion between the 5-yr and 10-yr breakevens. A healthy yield curve has longer maturities paying a higher rate. When the shorter term is higher than the longer term, we call that an inversion and points to a problem in the financial system.
This first chart shows the 5 and 10-yr breakevens charted together. You can see most of the time they are acting properly with the 5-yr under the 10-yr. However, back in 2005 and 2008, there was an inversion, and then again recently there has been a long running inversion, the largest inversion ever.
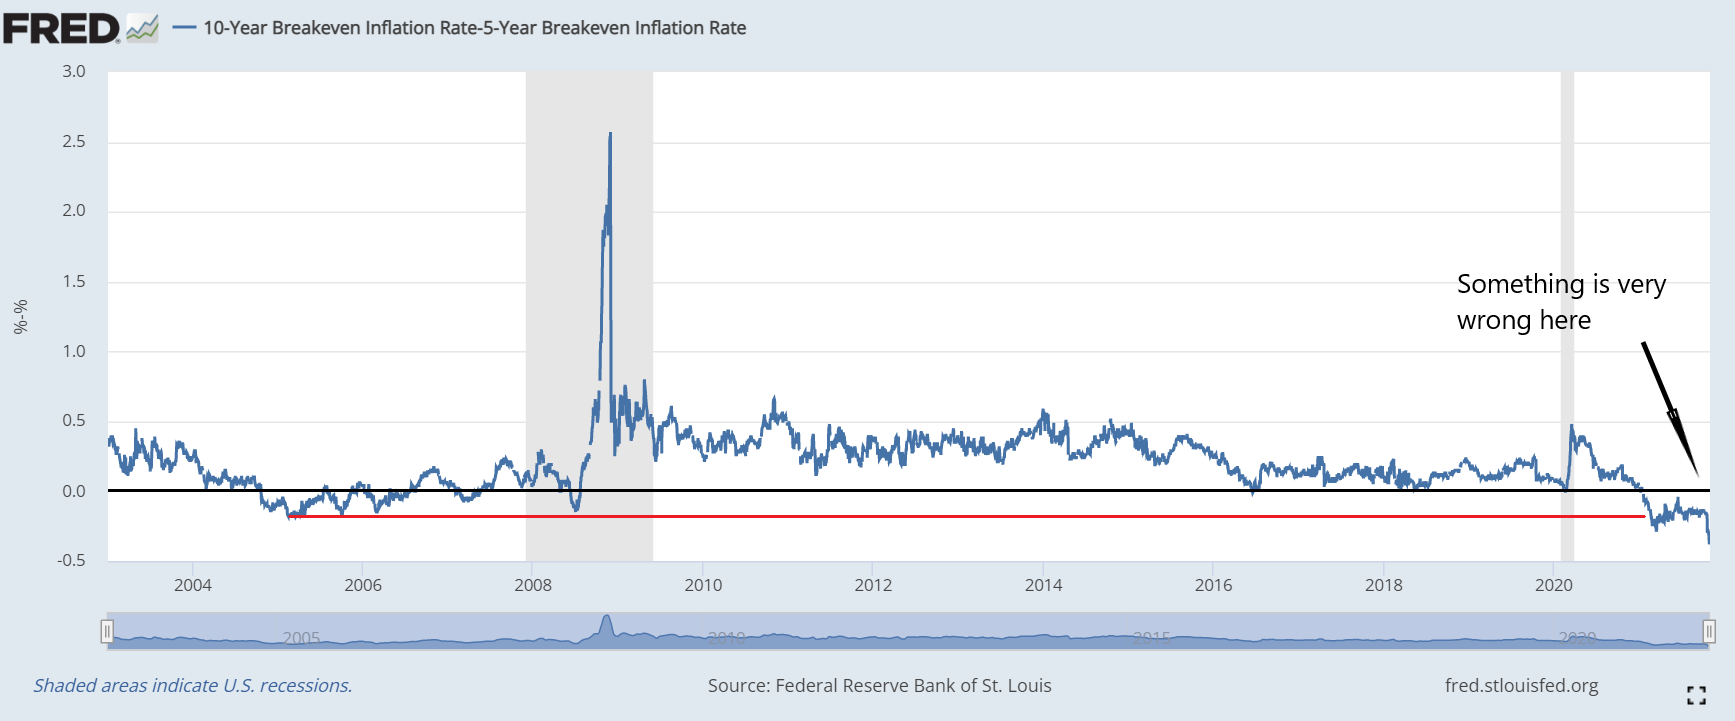
Here we can see the spread more clearly. It is staggering because it is signaling something very amiss with the financial system.
From an inflation perspective, both these numbers are below the CPI. The 5-yr breakeven is saying people expect 2.99% inflation (at the recent high) over the next 5 years, and the 10-yr is saying 2.69% at its recent high.
5y-5y Forward
Another measure we have looked at on this series before is the 5y-5y Forward rate. That is the "expected inflation (on average) over the five-year period that begins five years from today." So, between year 5 and year 10 from today, a far out in the future prediction from a formula.
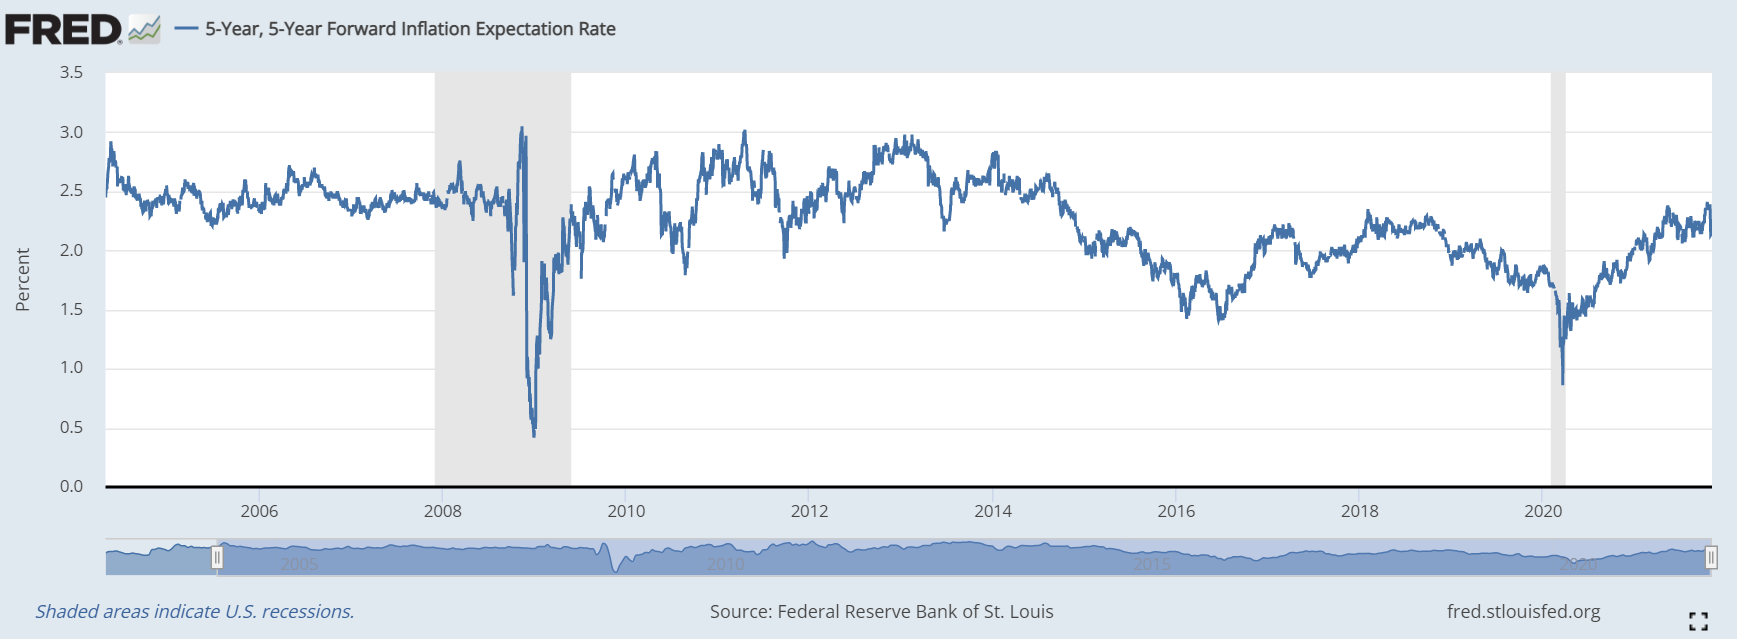
I included all the way back pre-GFC so we can put today's expected inflation in context, so when you hear "The highest inflation expectations in 8 years" you can say "so what?".
Currently this measure is 2.20% and right in line where it was in 2018. I think it is safe to say by looking at these charts that any random surprise will be the downside. Inflation is systemically impossible at this point, until we replace the money.
Shipping container rates
Last thing I want to look at today is shipping container rates. We'll look at the Baltic Dry index and the Freightos global average for 40-ft containers.
Baltic Dry Index (BDI)
Basically, the BDI it is a summary of raw material shipping rates. Description from Investopedia:
The Baltic Dry Index (BDI) is an index of average prices paid for the transport of dry bulk materials across more than 20 routes.
The BDI is often viewed as a leading indicator of economic activity because changes in the index reflect supply and demand for important materials used in manufacturing.
Baltic Dry Index is a composite of four sub-indices that measure different sizes of dry bulk carriers or merchant ships: Capesize, Panamax, Supramax, and Handysize.
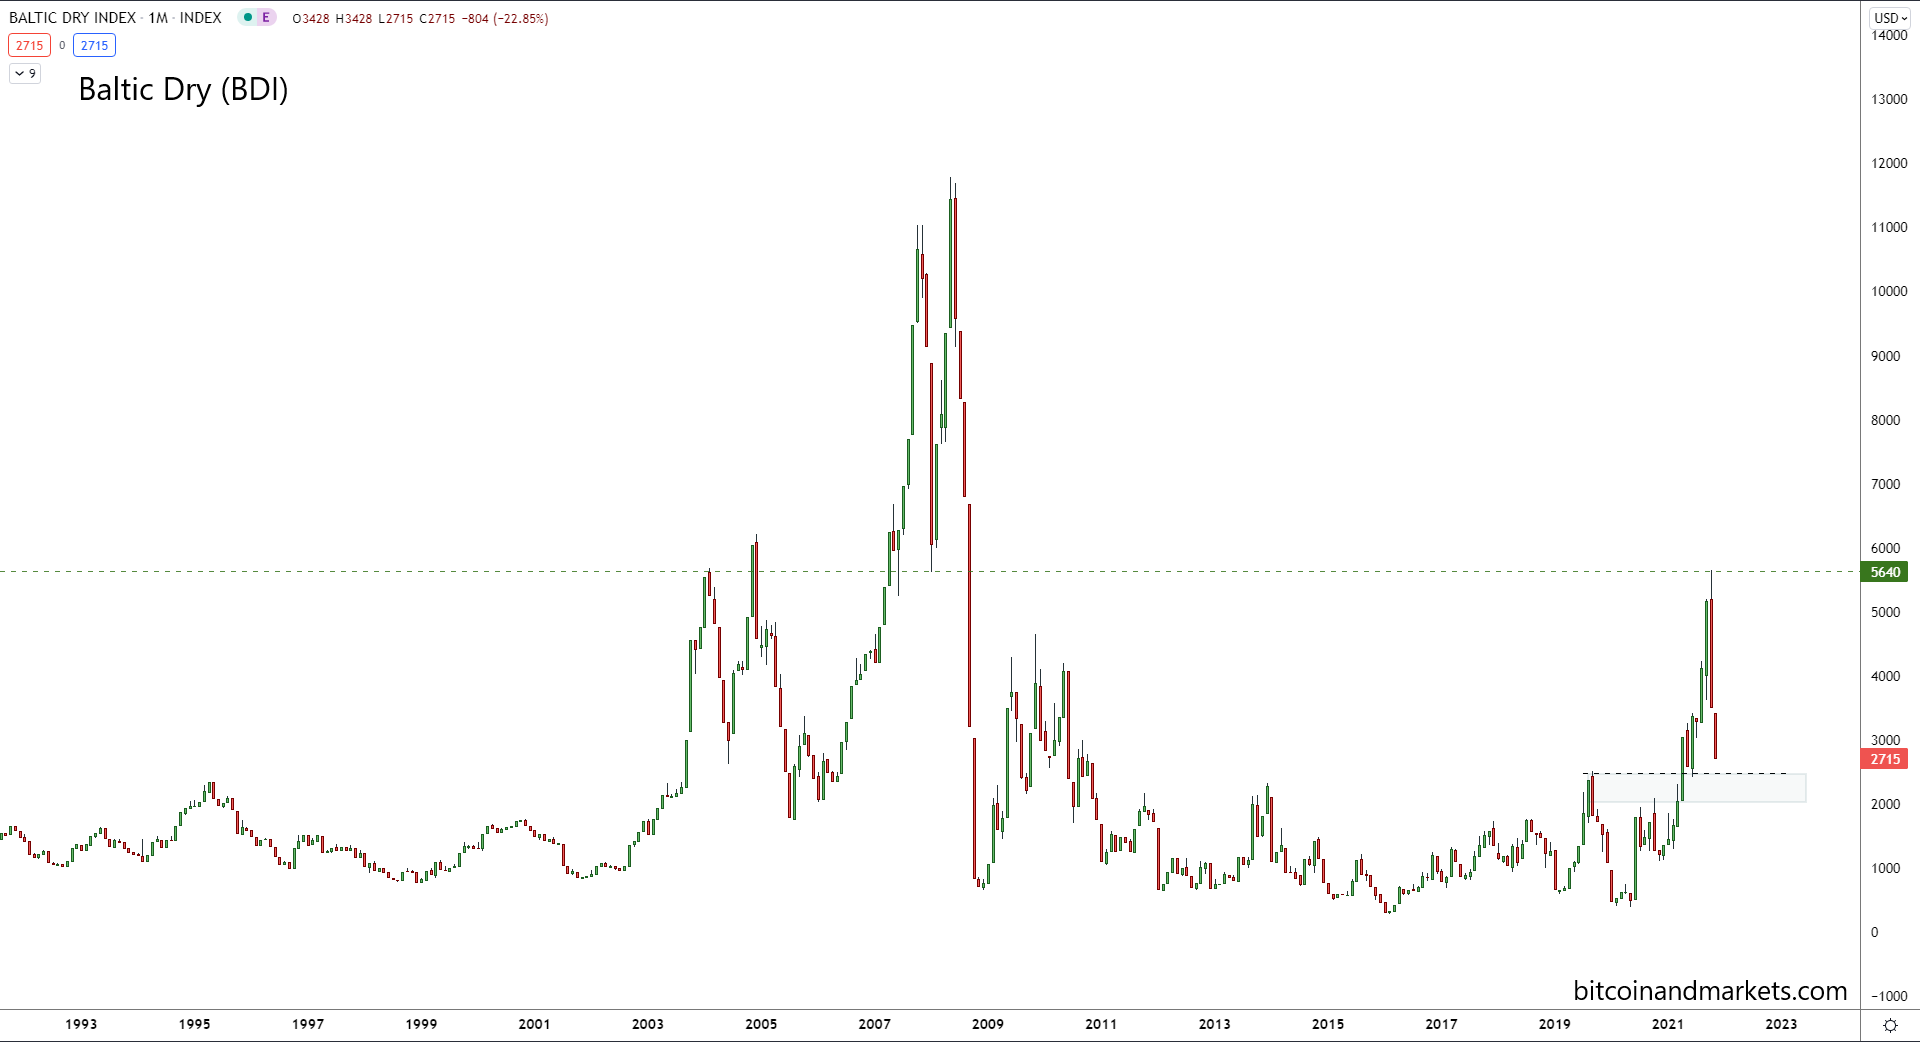
The recent spike in the BDI is somewhat reminiscent of 2003, but in a much slower and more fragile global economy that cannot maintain higher costs. As a meaningful part of commodity costs, the BDI dropping should have an impact on manufacturing costs as well. Does this look like a scary inflationary period? Nope.
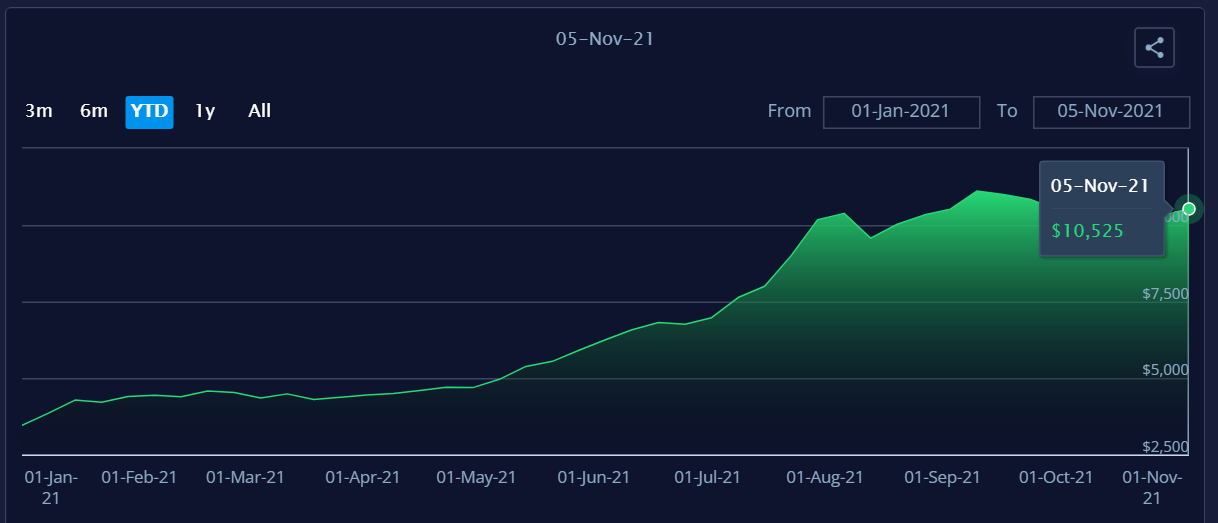
Freightos (FBX)
Frieghtos is an index measuring 40 foot containers (FEUs). Those are the big container ships parked off LA Long Beach right now. It is a new measure only going back to 2019, but what we can see on this chart is that it seems rates are leveling off and perhaps turning over to go down.
World Trade
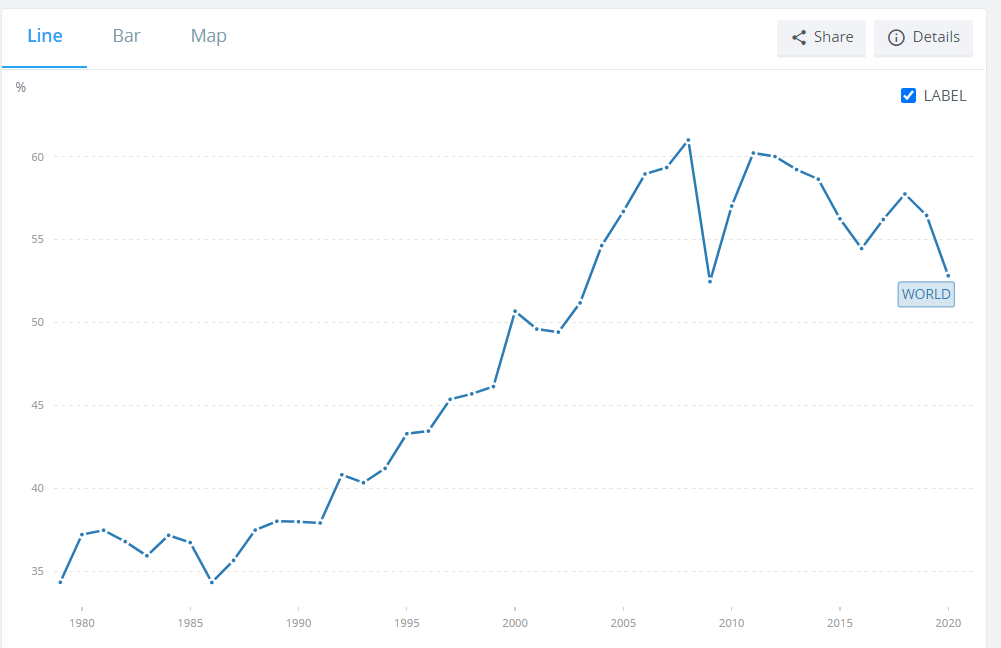
Part of the thesis here at Bitcoin & Markets is that global trade will decline dramatically over the next decade, as China peaks and the US realigns to the new trading partners.
As we see below in a chart from the World Bank, global trade is tanking as a percent of GDP. While it might have recovered slightly in 2021, the trend is becoming established, less global economic activity is going to be derived from long and complex supply chains.
Also, we have to weigh global freight rates in this context. Less stuff is being traded at a higher cost. That means higher costs are coming from higher demand, but from fracturing relationships and demand destruction.
That's where I'm going to leave it for this issue. Questions or comments, reach out on twitter to @AnselLindner.