Macro Minute: 1970s CPI versus Today
A Comparative Analysis of Historical and Modern CPI, and Why This is Not Like the 1970s
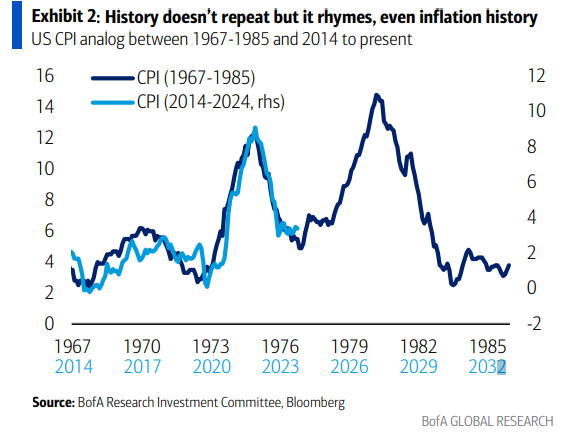
You often see inflationistas pull out this chart to sow FUD with the uninformed public. There are different versions, each with slightly different years, this is just the one I found more readily. It happens to be one of the more honest representations because they have two vertical axes and clearly labeled horizontal axis. However, it is still misleading.
This is how it should look. I took the commonly used starting point in 1966 through the bottom of the last big spike in 1983 on the left and superimposed it to the current day starting from where most people start it. As you can see the inflation in the 70's was much worse and came in three waves.
1) Jan 1970 peaked at 6.2%
2) Nov 1974 peaked at 12.3%
3) Mar 1980 peaked at 14.8%
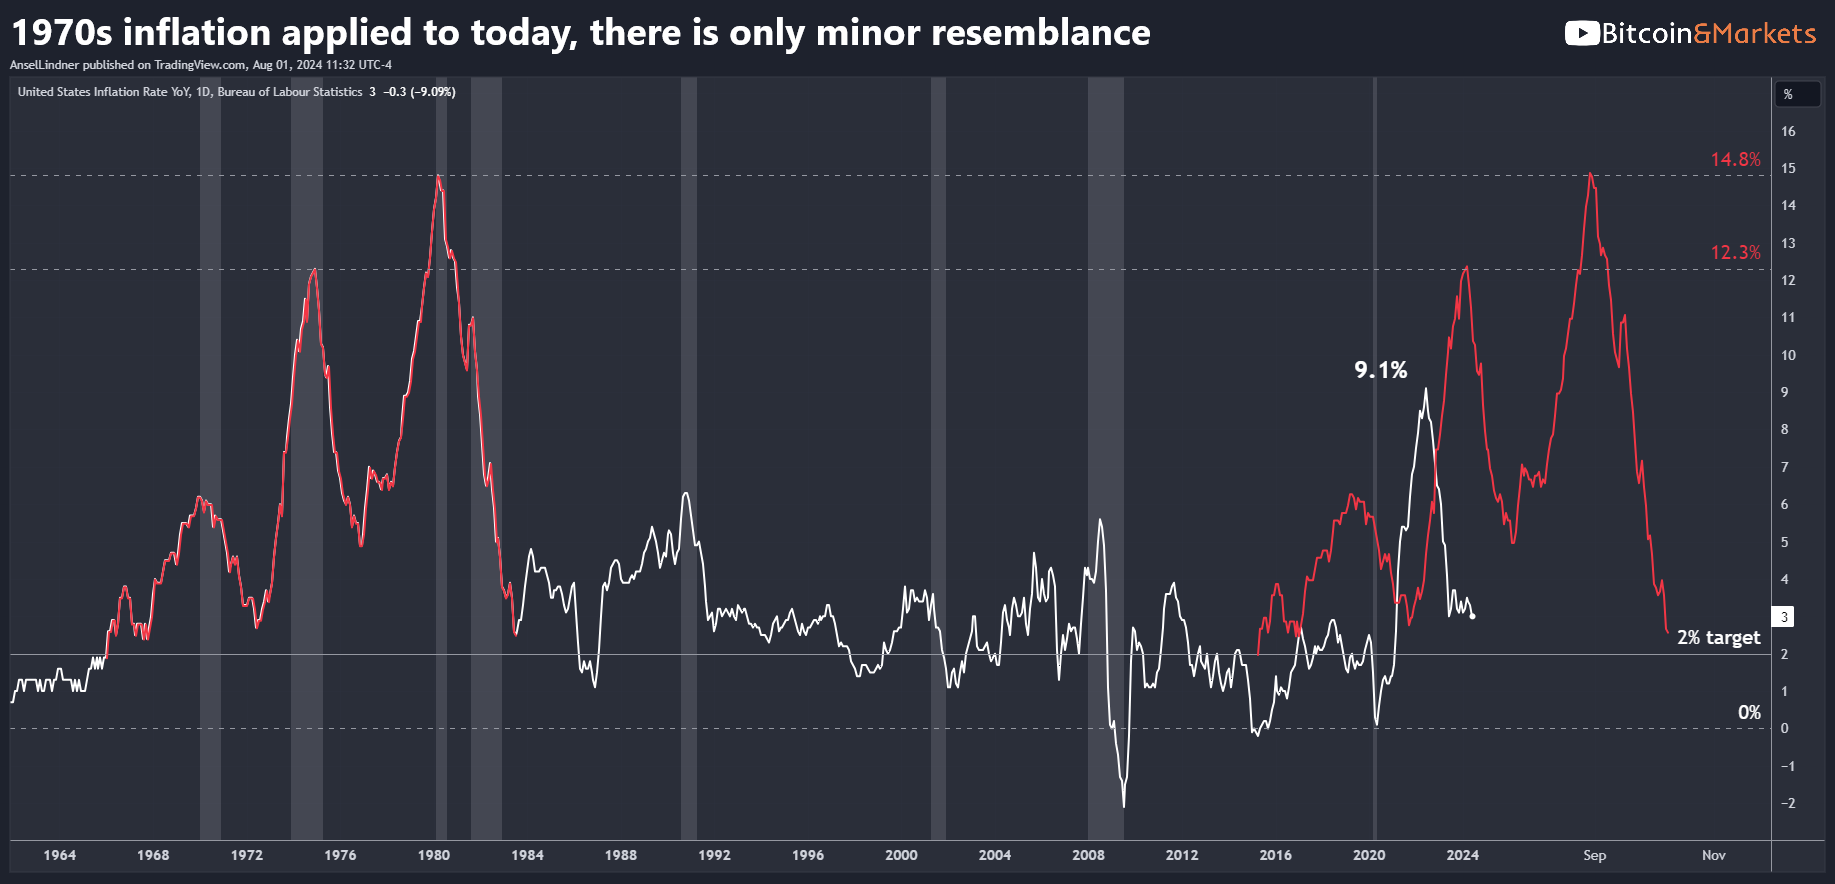
The 1970's inflation also started from a higher base of 2%. That is because the global dollar system was still expanding and economic growth was robust at the time. Today is much different. Our system is saturated with debt and we have low growth. The recent wave of higher CPI started from 0% and in one rapid, transitory rise peaked at 9.1%.
The length of these waves is not as coincidental as you might think, it is dictated in large part by the nature of the year-over-year (YoY) measurement itself. It takes 12 months for the highest numbers to be fully represented, and then another 12 months to work their way out.
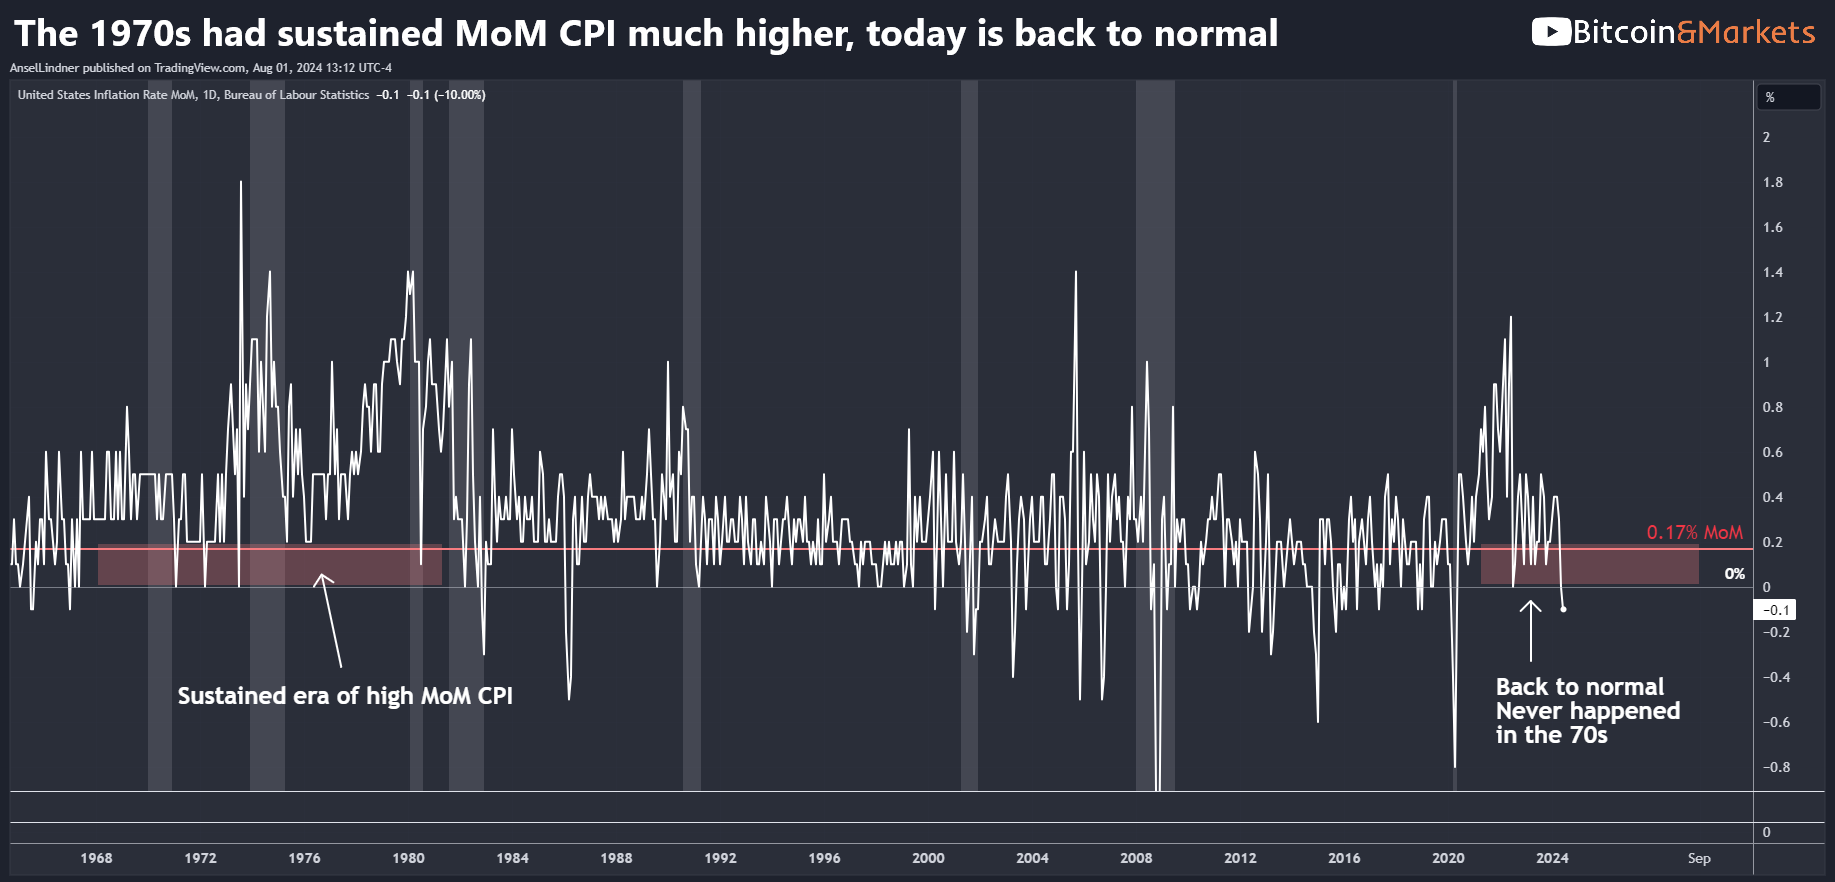
Turning to the month-over-month (MoM) measurement, we can see some big differences here as well. I put a red horizontal line at 0.17%, which is the average needed to reach 2% YoY. The 1970s saw a sustained period of CPI over the 0.17% mark–almost the entire time between 1968 and 1981. Today, CPI is consistently falling into the lower MoM range. This is much different behavior that happens to look similarly shaped on the YoY chart because of the way YoY is constructed.
Or recent bout of "inflation" was transitory, and I called it transitory from the beginning. I based that prediction on the nature of the crisis (supply chains) and the nature of the monetary system (in a long drawn-out deflationary bust). Hope that helps.
Hold strong and have a great day,
Ansel
- Were you forwarded this post? You can subscribe here.
- Please SHARE with others who might like it!
- Join our community on Telegram!
- Become a Professional member and unlock premium content!
DONATE directly on Strike or Cash App to support my work! You make my content possible! Thank you.
Disclaimer: The content of Bitcoin & Markets shall not be construed as tax, legal or financial advice. Do you own research.


