Macro Minute: Has The Buffett Indicator Outlived Its Usefulness?
Explore the limitations of the Buffett Indicator in today's economy, including shifts in market behavior, the evolving role of major stocks, and long-term GDP distortions.


I cannot provide this important Bitcoin and Macro analysis without you.
Bitcoin & Markets is enabled by readers like you!
Today, I'd like to take a look at the Buffett Indicator, popularized, of course, by Warren Buffett, with whom I share a hometown. It is widely used to gauge whether the stock market is undervalued, fairly valued, or overvalued, providing a starting point for understanding market evolution over the past 50 years—and where it might be headed.
The Buffett Indicator formula is simple:
Buffett Indicator = (Total Market Capitalization / GDP) × 100
Its readings suggest different market conditions:
- Below 75%: Undervalued, signaling potential buying opportunities.
- 75% - 100%: Fairly valued, suggesting stability.
- Above 100%: Overvalued, which could warrant caution.
When the ratio exceeds 100%, it indicates that the stock market's valuation is outpacing the economy’s capacity, often foreshadowing recession. Conversely, lower readings can suggest room for market growth.
Limitations of Stock Market Cap
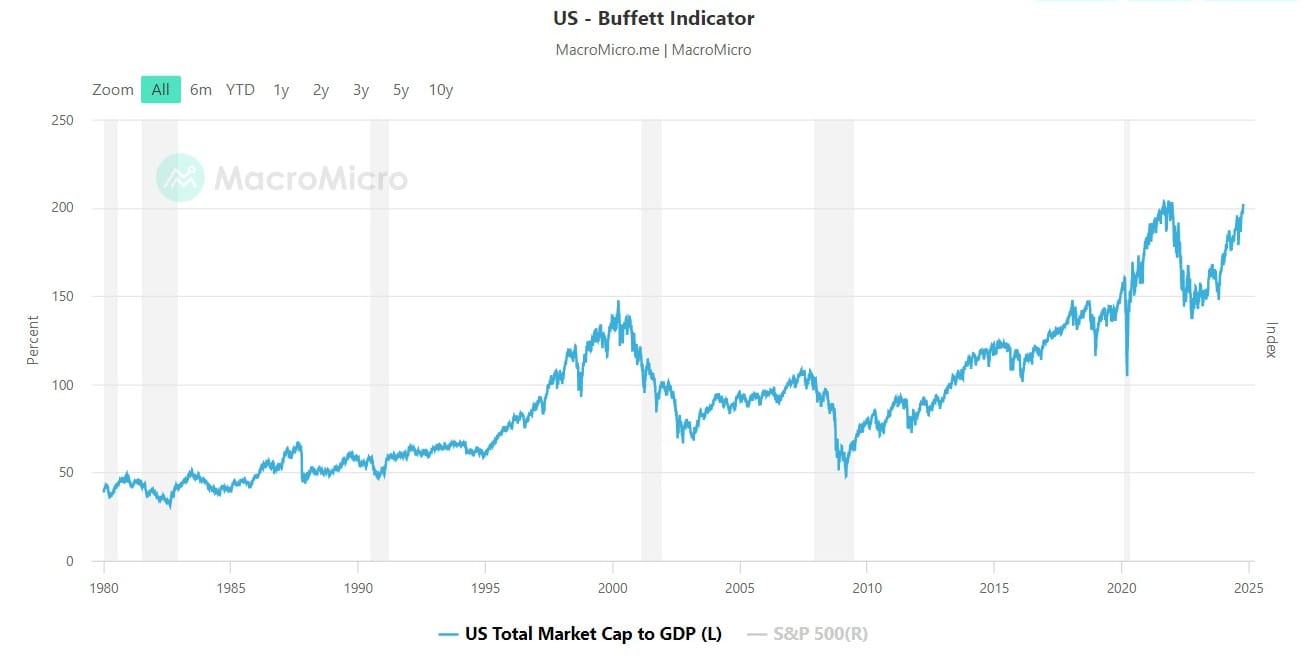
As the chart below illustrates, the Buffett Indicator has been in unusual territory for the past decade. Following the Great Financial Crisis, it dipped to 50%, but rebounded above 100% by 2014 and didn’t even fall below that threshold during the COVID crash. According to the Buffett rule, the stock market has been extremely overvalued for a decade, but that cannot be the case. There are known limitations to this indicator, as well as fundamental changes in the macroeconomic environment driving these trends.
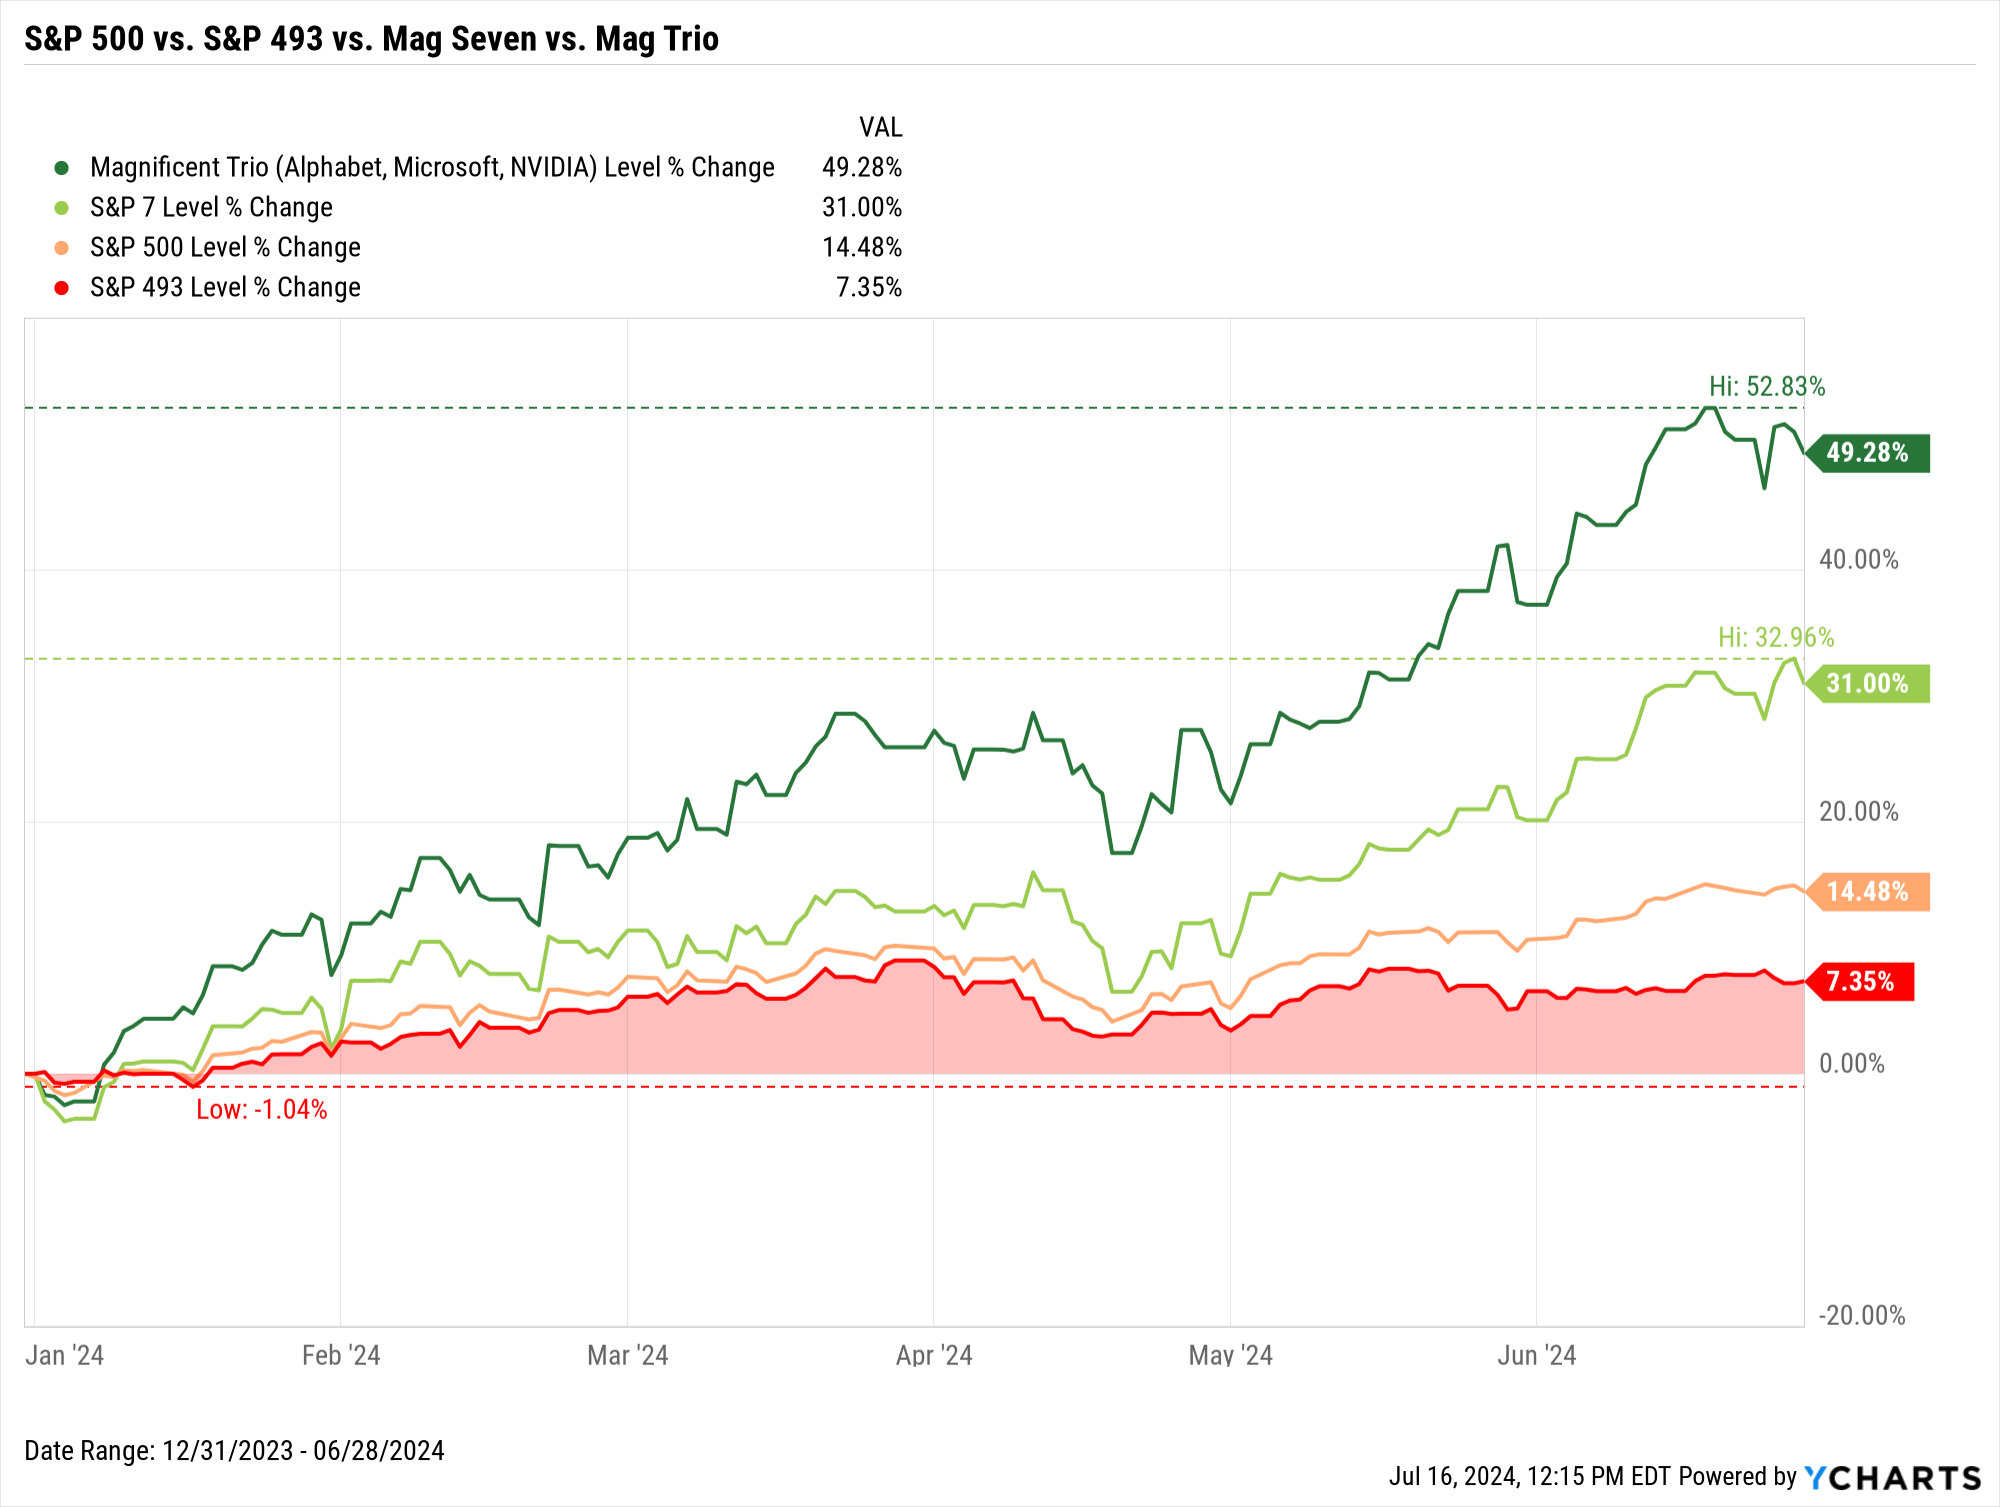
The mainstream explanation is that artificially low interest rates make stocks appear more attractive relative to bonds, leading to higher readings that would typically signal overvaluation. However, we know rates are not artificially low, they are low due to macroeconomic conditions, specifically dollar and credit shortages in a credit-based system. These tight financial conditions periodically cause financial crises and push investors toward safe and liquid assets. While stocks are traditionally not seen as safe and liquid assets, certain large-cap stocks have gradually taken on that role, which is why we see a concentration of returns in a few dominant names like the FAANG or "Magnificent 7."
Globalization and sector-specific dynamics also complicate the indicator's interpretation. Many large companies derive significant revenue from international markets, making their valuations less tied to domestic GDP.
Limitations of GDP
While GDP is generally accurate on a quarter-to-quarter or even year-to-year basis, it deviates over longer timeframes due to the varying productivity of different types of investment and spending.
GDP treats all forms of spending as equally productive, whether from the private sector or government. However, the economic value generated by these expenditures can differ significantly. Private sector investment, predicated off private sector spending, is typically aimed at efficiency and profitability, directing resources toward the highest potential returns.
In contrast, government spending is by definition not what the private sector sees fit to spend money on, and is therefore, not the most efficient or profitable uses of that spending. This leads to a discrepancy in the actual value added to the economy that compounds or accretes with time. These distortions become more pronounced as government spending constitutes a larger share of overall economic activity.
Usefulness of the Buffett Indicator
After examining both the numerator and denominator of the Buffett Indicator, it’s clear that the measure’s components have shifted since it was originally designed. The numerator (market cap) is now prone to overvaluation in times of rising uncertainty, as a narrow group of large stocks serve increasingly as safe havens. Meanwhile, the denominator (GDP) is distorted by overestimated economic growth over the long term.
Nonetheless, the indicator can still offer valuable insights. The stock market distortion, in my view, is more pronounced than the GDP distortion, meaning the Buffett Indicator's readings are likely to rise over time as investors treat a small group of well-known stocks more like safe and liquid assets. Given this trend, it is noteworthy that the current reading is only now surpassing the peak reached during the 2020 COVID crisis.
Considering the broader macroeconomic dysfunction (e.g., solving debt problems by issuing more unproductive debt), we should expect each crisis to push the "overvalued" reading higher, as more investors seek safety in a narrowing field of assets. Therefore, the fact that the Buffett Indicator is just now exceeding its 2020 high does not necessarily signal an impending crash, but rather indicates that we are at the beginning stages of becoming overvalued once again.
Takeaway: While the Buffett Indicator still serves as a useful reference, interpreting it requires an understanding of the underlying evolution in the monetary system, market behavior and economic conditions over time.
Hope this helps someone.
Your support is crucial in helping us grow and spread my unique message. Please consider donating via Strike or Cash App or becoming a member today and get more critical insights!
Follow me on X @AnselLindner.
I cannot provide this important Bitcoin and Macro analysis without you.
Bitcoin & Markets is enabled by readers like you!
Hold strong and have a great day,
Ansel
- Were you forwarded this post? You can subscribe here.
- Please SHARE with others who might like it!
- Join our Telegram community
- Also available on Substack.
Disclaimer: The content of Bitcoin & Markets shall not be construed as tax, legal or financial advice. Do you own research.


