Macro Minute: Predicted Stabilization in Markets, Decision Time
Understanding last week's panic, Bitcoin's rebound, and the time scales guiding long-term market trends.

Last Monday, during the massive sell off, I opened the Bitcoin Fundamentals Report with this:
... panic is in the streets; it's a great time to buy the dip.
I built a narrative on the Report and on the associated live stream that markets the selling was driven by panic, not fundamentals, and markets were likely bottoming. The next day, on a Macro Minute, I explained what I was thinking for bounces and stabilization of the market. I mentioned the S&P could return to a new ATH shortly.
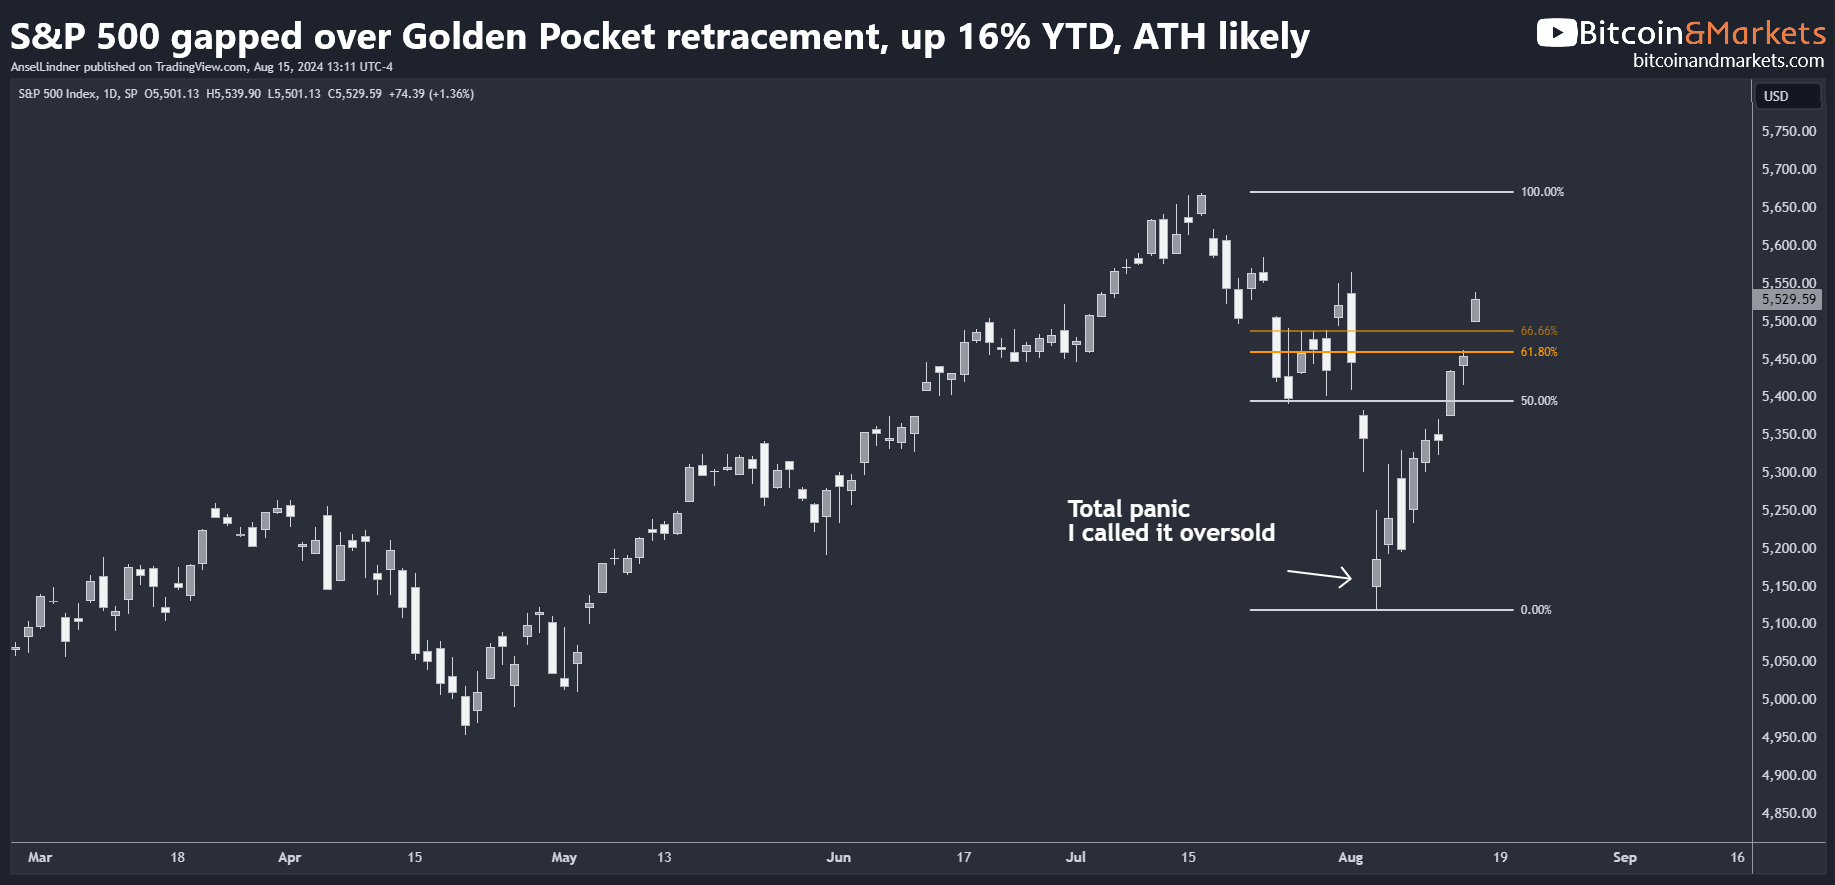
On the S&P 500 chart we see that price jumped right past the 61.8% Fib retracement level in a very strong move. A new ATH won't come this week, but might be in the cards for next week.
As for the 2Y Treasury yield, the bottom it put in is holding perfectly. Right now, the yield is threatening to break horizontal resistance from the bottom at the beginning of the year.
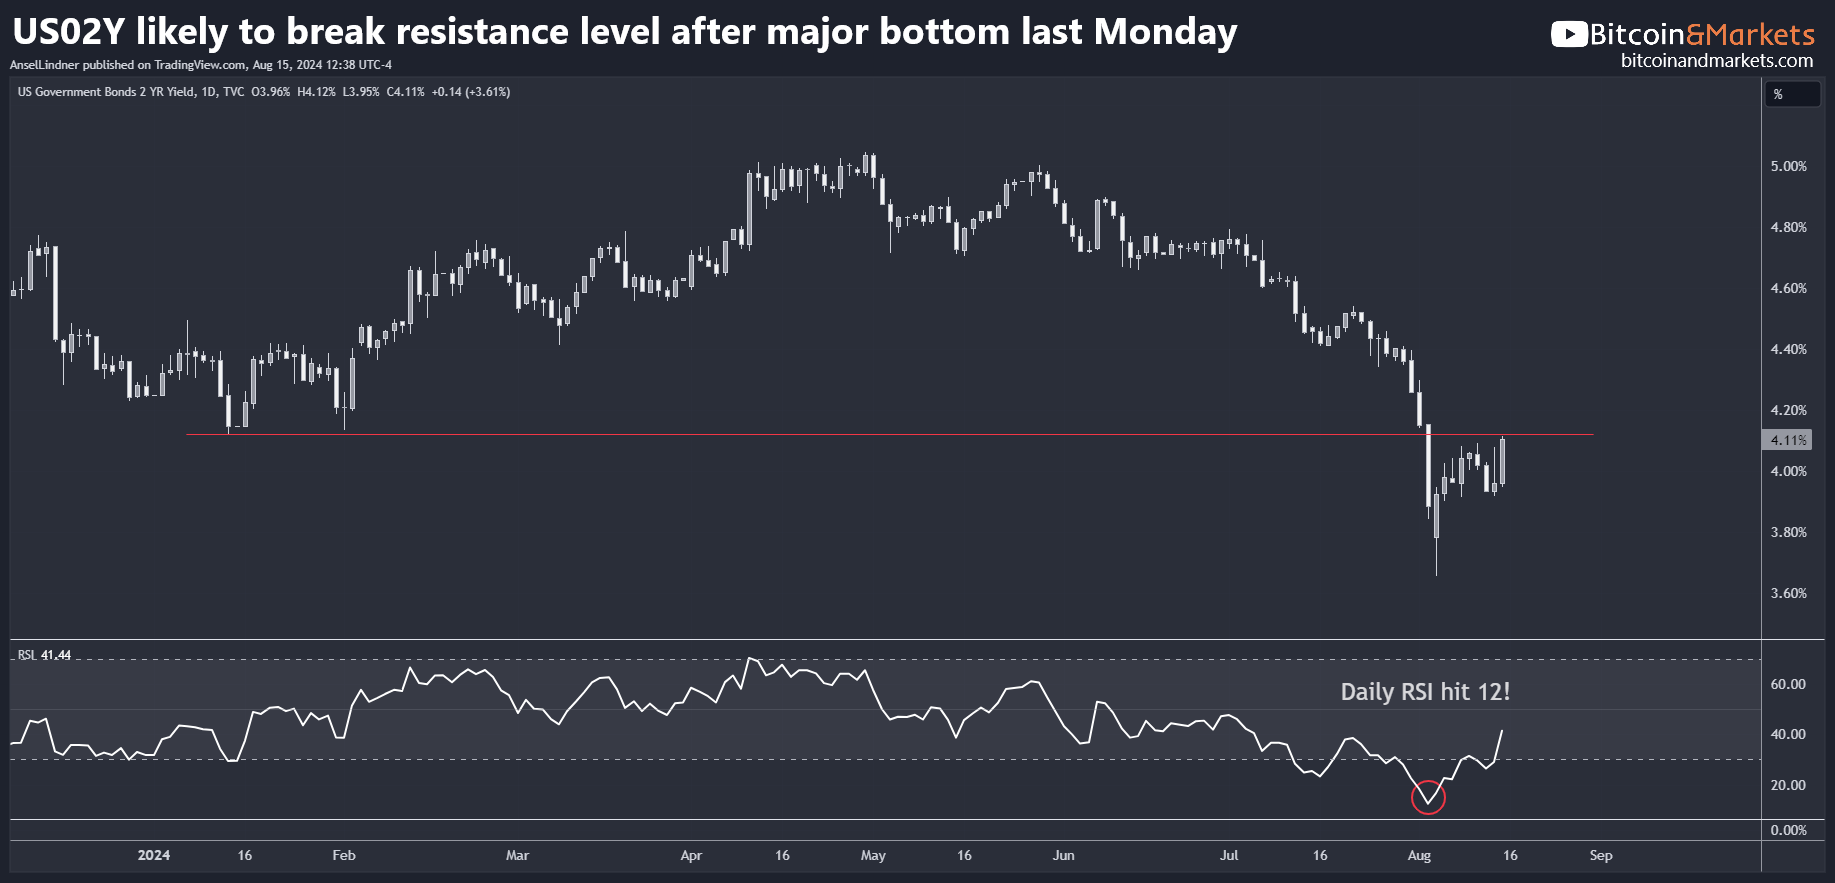
The condition of the above chart is what led me to claim last Monday could be a multi-month bottom. It was so oversold, that a length correction was likely. Six to eight weeks takes us right around the end of Q3, which is my focus for seasonal disruptions.
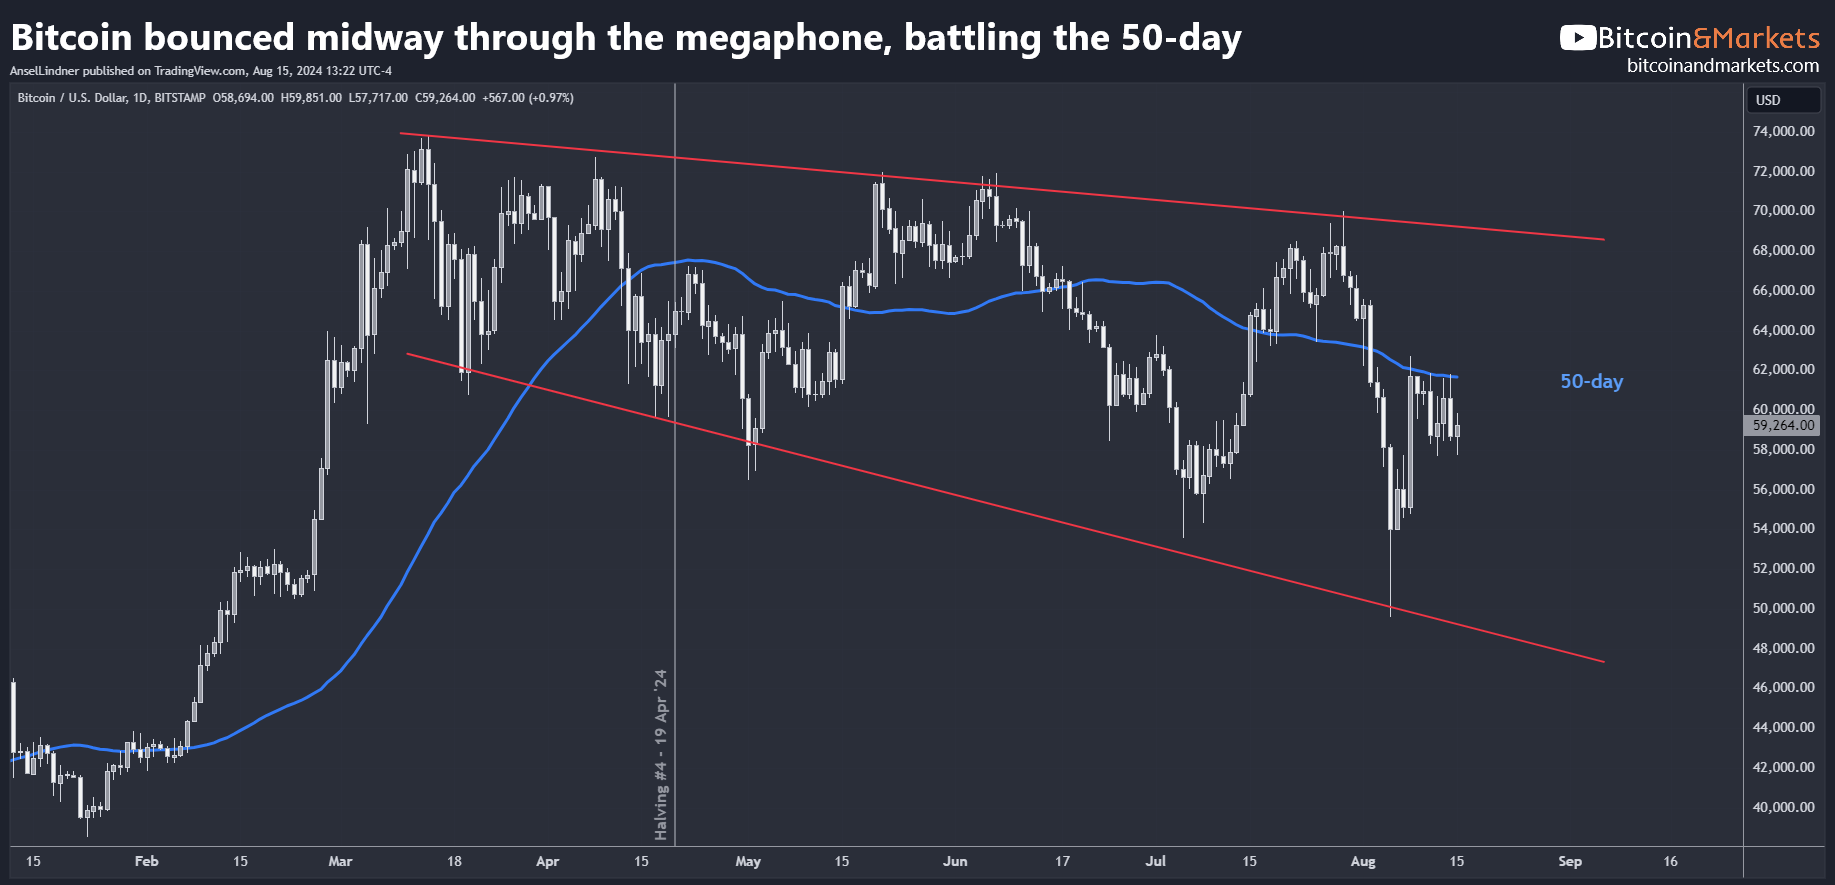
Bitcoin bounced strongly as well, and has been battling with the 50-day MA for a week now. It is chipping away at any liquidity there and likely to break higher soon.
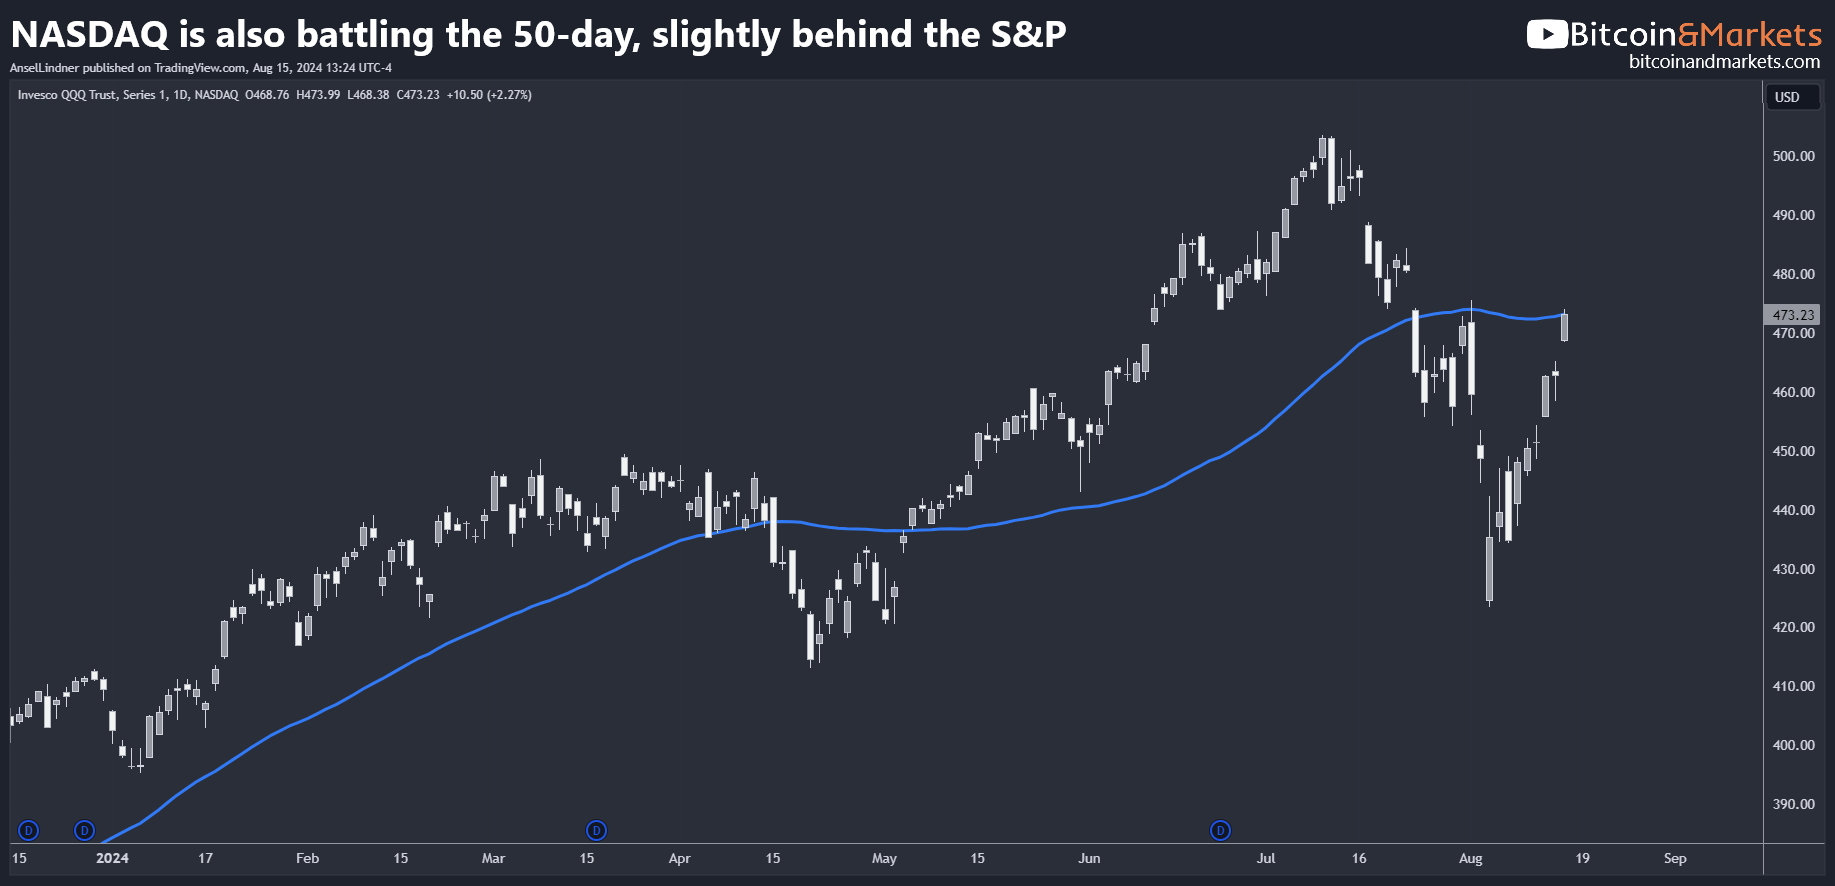
The struggle with the 50-day is very similar to the Nasdaq. Where the S&P 500 has leapt above the 50-day, the Nasdaq is starting to play catch up. If it breaks tomorrow, bitcoin could do the same.
This is not the end of the story. Last week's panic is just a singular event in the evolution of the global market. We are heading into recession and lower stock prices and lower yields, but it has to come in its own time.
Unlike other analysts that drown their work in 100's of data points to ascertain where the market is and where it is going over the near or medium term, I have an overarching theory that works by constraining the possibilities.
Time Scales
I haven't outlined these time scales clearly in my previous writing, because it is more of a social theory behind my macro thesis, but I'll outline it briefly here. Working from large to small:
Centuries
Social Cycles on grand time scales along the lines of Turchin or Strauss and Howe. These cycles are driven by humans reacting to major shifts in the environment or technology. Smelting iron, discovering the Americas, the printing press, discovering electro-magnetism, warm or cool periods lasting a century or more, discovery of Bitcoin, etc. As well as a generational cycle like the Fourth Turning. This is a meaty subject, so lets just move on.
Decades
Our current situation on the back-half of a great bubble, constrains the long-term direction of the market toward lower growth and inflation over a long-term timeframe. This is due to global debt saturation and demographics.
Years
On the scale of years, we have the business cycle, nested within the decade structure from above. Today, that is the fading decades of a great bubble. We will experience crises followed by periods of reflation, which will continue until credit conditions get so tight, we start seeing failures and layoffs, followed by a crisis again. The crises will subside, but will never get back to previous growth or escape velocity before the next cycle end. Until we radically change the system and culture, including the form of money.
Months
On the month scale we have things like market disruptions and seasonal concerns. Massive disruptions like the sanctions on Russia in 2022, will lead to massive price swings, but cannot break out of the higher scale processes. COVID is another example of a massive disruption never really experienced before. It's effects stretched into the years, but being classified as mainly a disruption, means it didn't have the ability to break us out of the higher scale processes. The tops and bottoms of these disruptions can offer further insights into the yearly cycles.
Daily
Lastly, we have a daily scale. This is driven by emotion, Schelling points on the chart, and further shaped by the higher scales. For instance, why we could call last week a temporary panic instead of the start of imminent collapse, was because of oversold conditions on the charts and the monthly and yearly scales. We weren't at the stage for a crisis quite yet, but it is coming.
I hope that makes my approach a little more clear.

Hold strong and have a great day,
Ansel
- Were you forwarded this post? You can subscribe here.
- Please SHARE with others who might like it!
- Join our community on Telegram!
- Become a Professional member and unlock premium content!
DONATE directly on Strike or Cash App to support my work! You make my content possible! Thank you.
Disclaimer: The content of Bitcoin & Markets shall not be construed as tax, legal or financial advice. Do you own research.