Macro Minute: Recession Risks Rise as Yield Curves Un-Invert
Understanding the significance of the 10Y-2Y yield curve un-inverting while the 10Y-3M remains deeply inverted, and what this divergence means for predicting future economic downturns and investment strategies.


LIMITED TIME
Supporting independent Bitcoin and Macro analysis!
Enter our monthly Price Forecast competition
Access to the clickable version of the Bitcoin Pre-History infographic
PDF version of The Bitcoin Dictionary
2/10Y Threatening to Un-invert
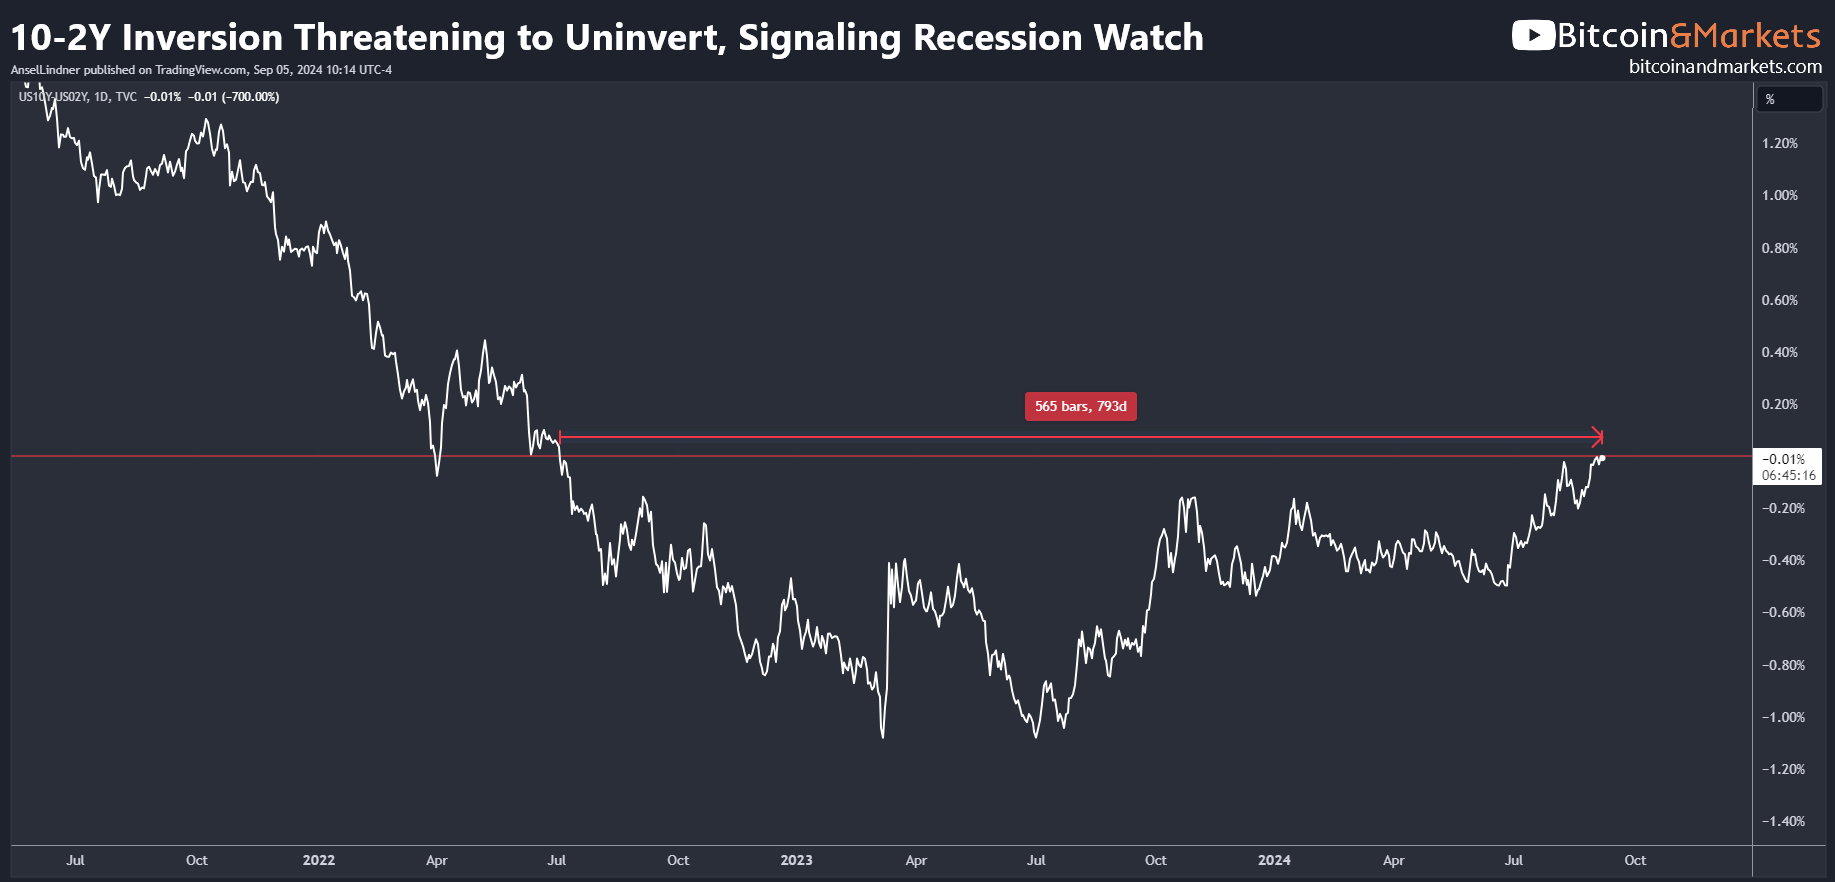
After crossing the un-inversion line on August 5th on an intraday basis, today's trading suggests it might close above the 0% inversion line.
This is a significant signal that many have been waiting for as it could indicate an imminent recession. We can add this to the triggering of the Sahm rule, both of which are extremely reliable indicators. Therefore, our base case must be that a recession will start in the next few months. However, it won't be officially recognized until approximately six months later.
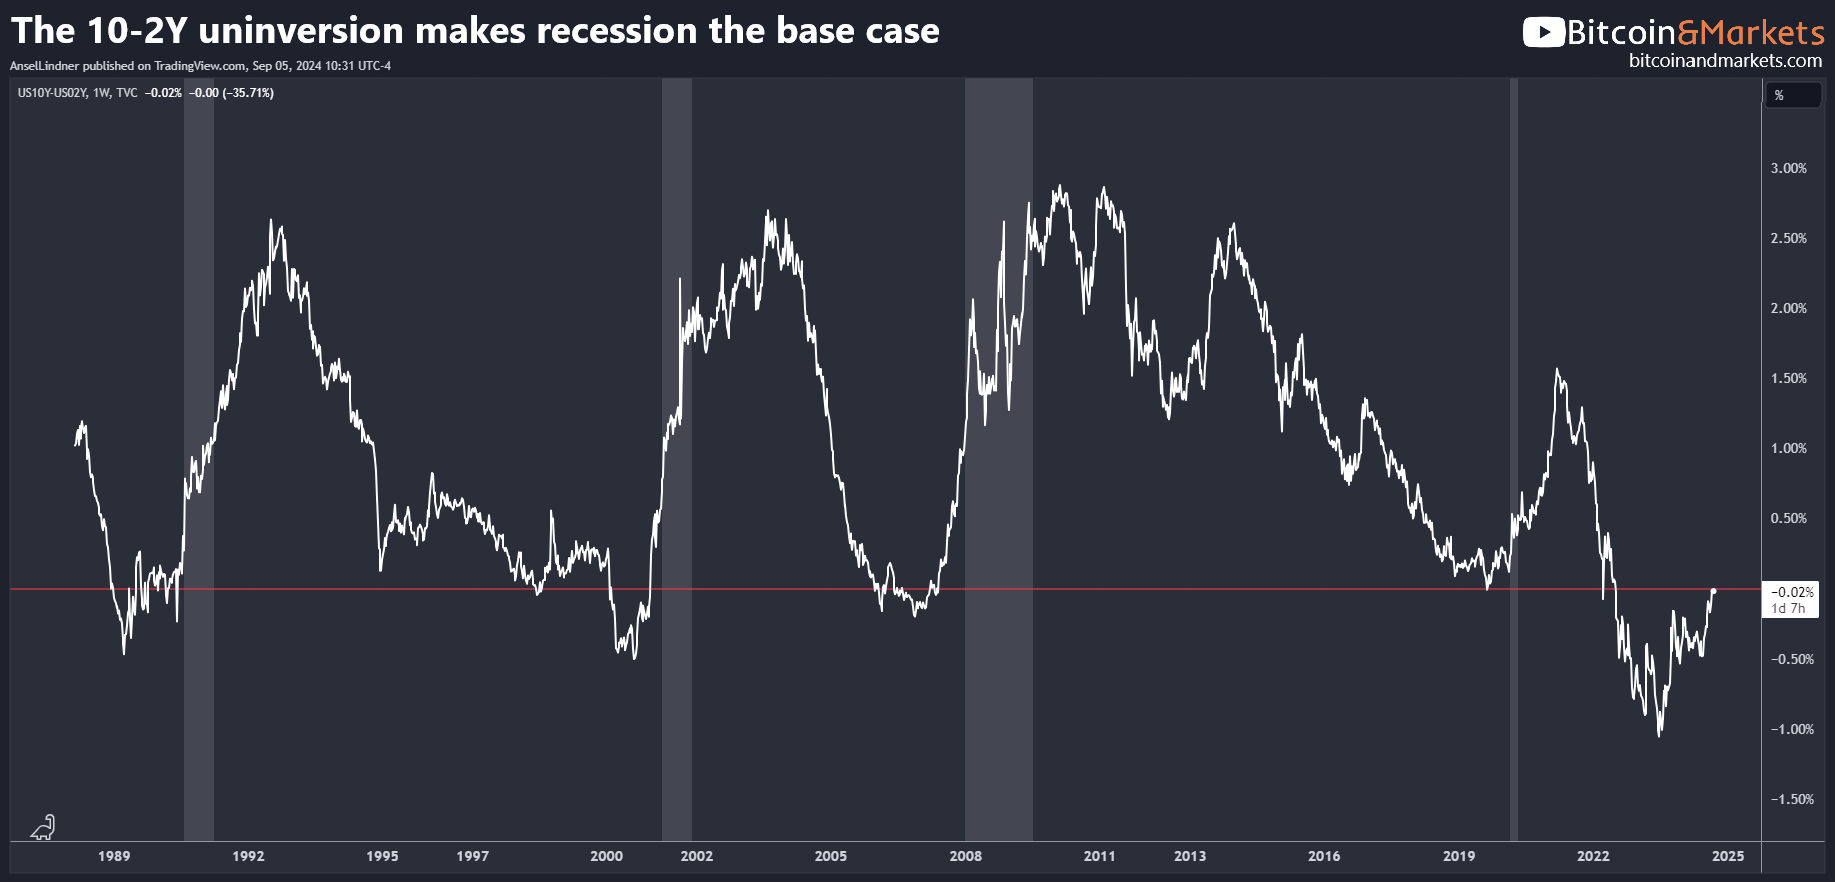
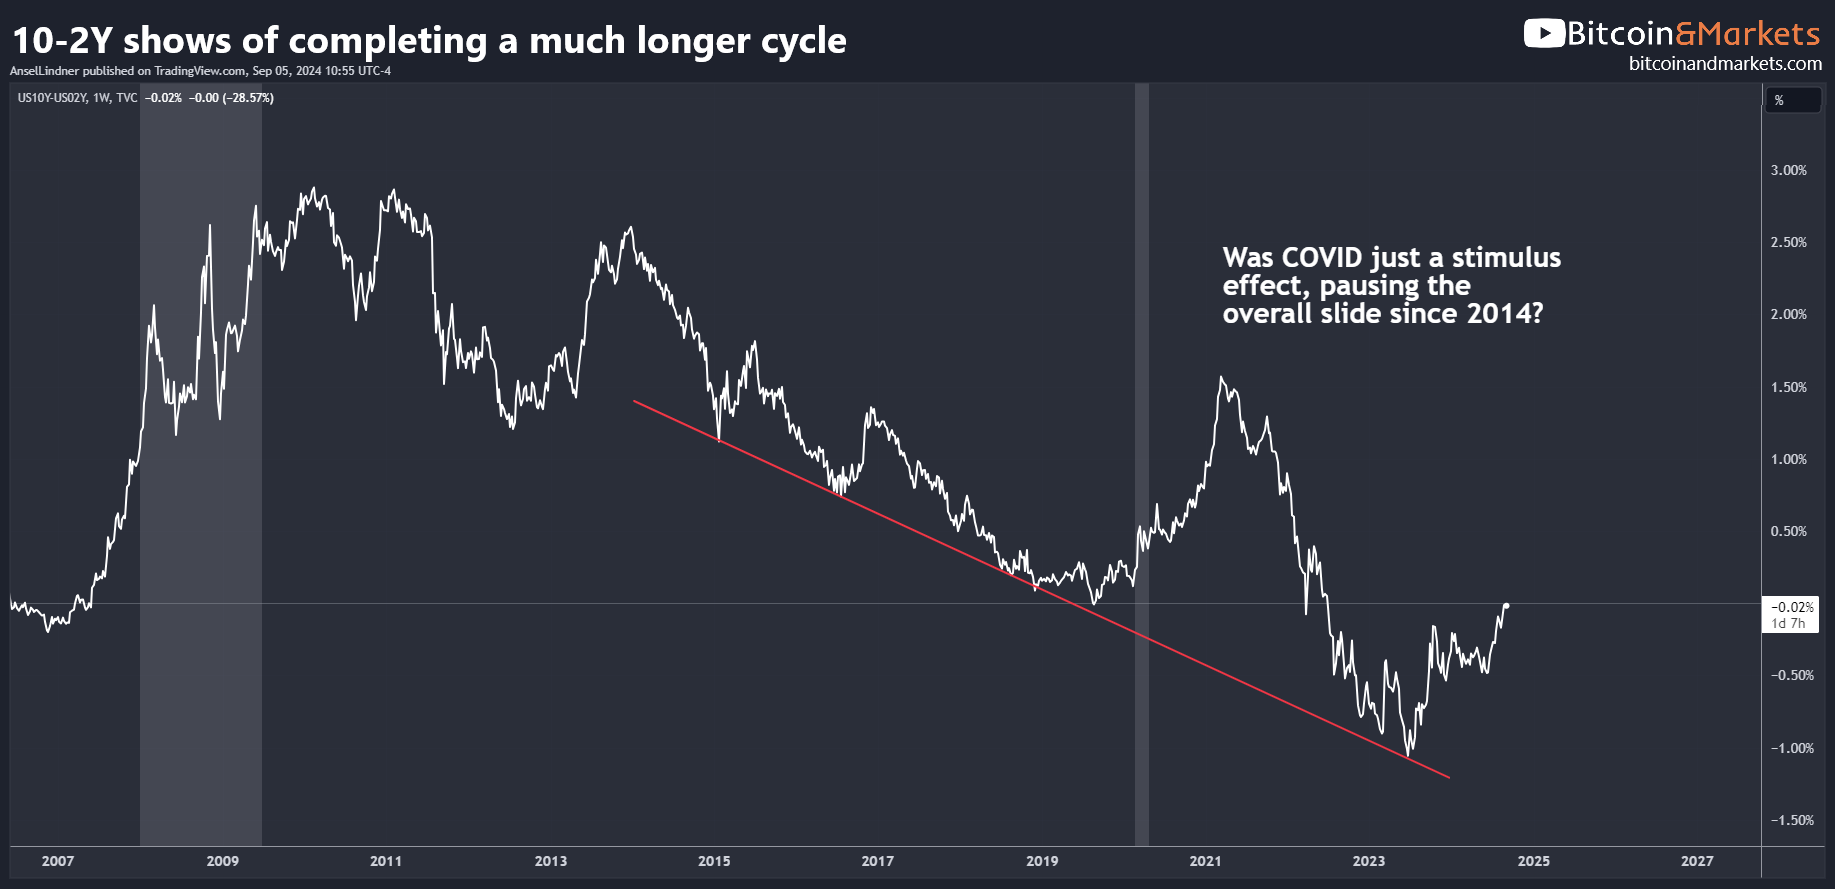
I noticed this on the 10Y-2Y yield curve chart below. It's possible that this inversion was deeper than any we've seen in the last 40 years, and the longest in nearly 80 years, because the COVID bump simply delayed the recession we would have experienced in 2020-2021 anyway. The depth and length of the inversion were likely a larger reaction to the temporary delay caused by the COVID response.
Regardless, our base case must now be for a recession in the very near future. We should start assessing markets to understand what this means for different assets, especially Bitcoin.
Pre-recession to Imminent-recession
For the last couple of years, I've been discussing the pre-recession trade based on historical precedents from the last 50 years. In the lead-up to a recession, stocks, bonds, and gold tend to perform well. Now that Bitcoin is a major asset class, it is naturally included in this group. This represents a wide swath of asset classes, only excluding commodities, which were expected to be bearish. Bonds struggled a bit early on in this call but are now up 25% from the October '23 low.
As a recession approaches, the pre-recession trade is going to shift into an imminent-recession trade. Below, the gray shaded area represents the Global Financial Crisis (GFC), and I've selected several assets to analyze. Bonds fell in the lead-up to the GFC but then flatlined for the first half. The dollar dipped and then rallied shortly after to new highs. Notice that in extreme stress scenarios, like the end of 2008, the US 10Y yield crashed along with the dollar, but both recovered over the following months. Stocks dipped throughout most of the recession period but bottomed well before the official end of the recession.
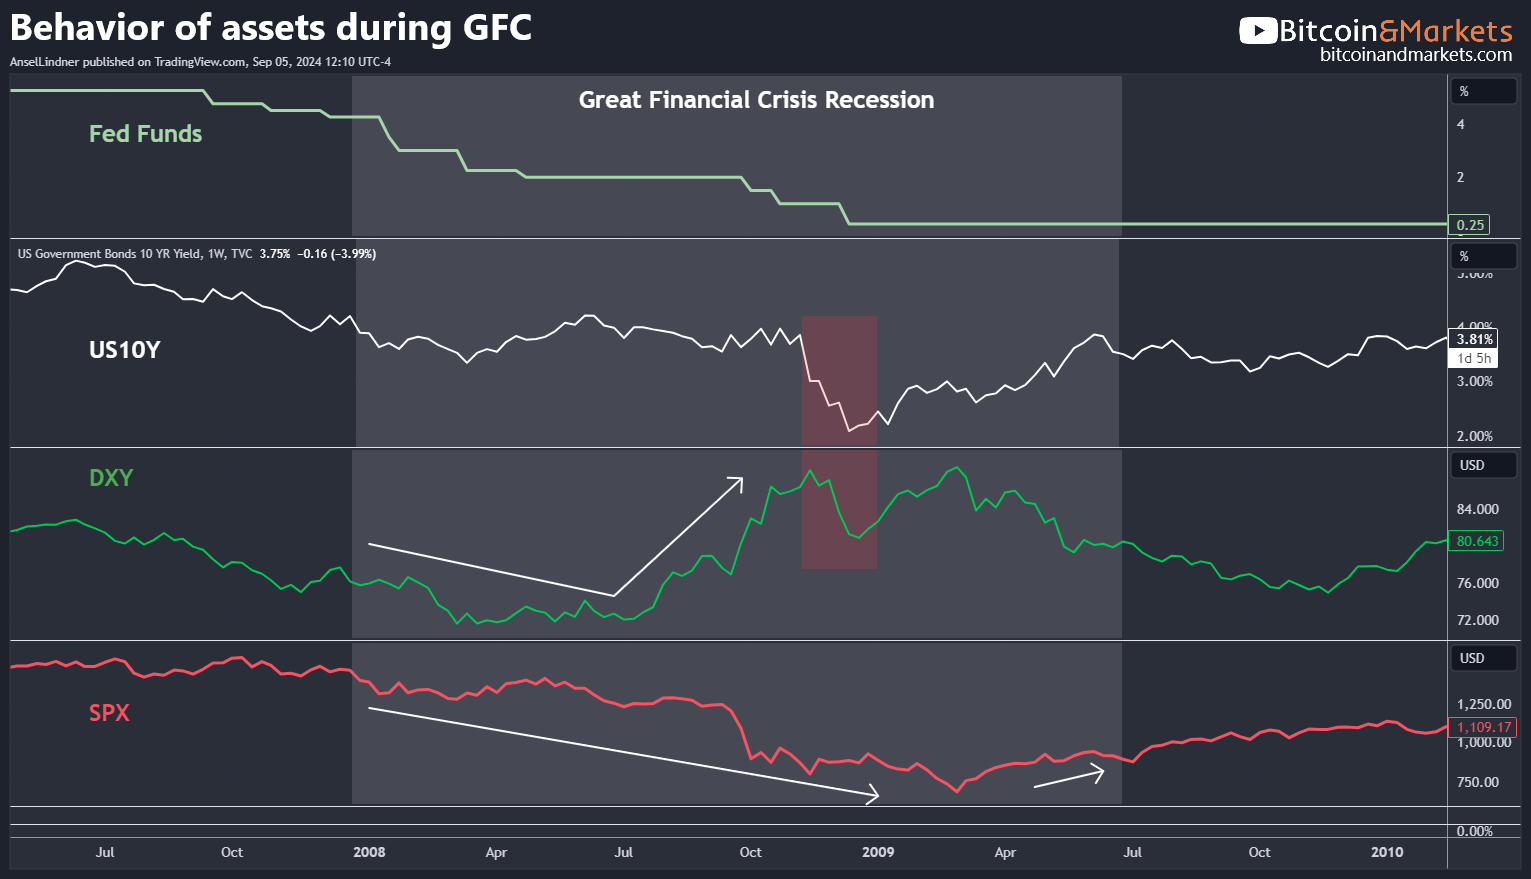
This is the general pattern I believe will repeat. Many analysts and commentators claim this is the "last" crash and that the dollar is finished along with the "everything bubble." I do not subscribe to that narrative. Markets will crash, and then Fed policy and government fiscal policy will backstop the economy, after which we will likely resume a "lower for longer" trend—lower growth, lower inflation.
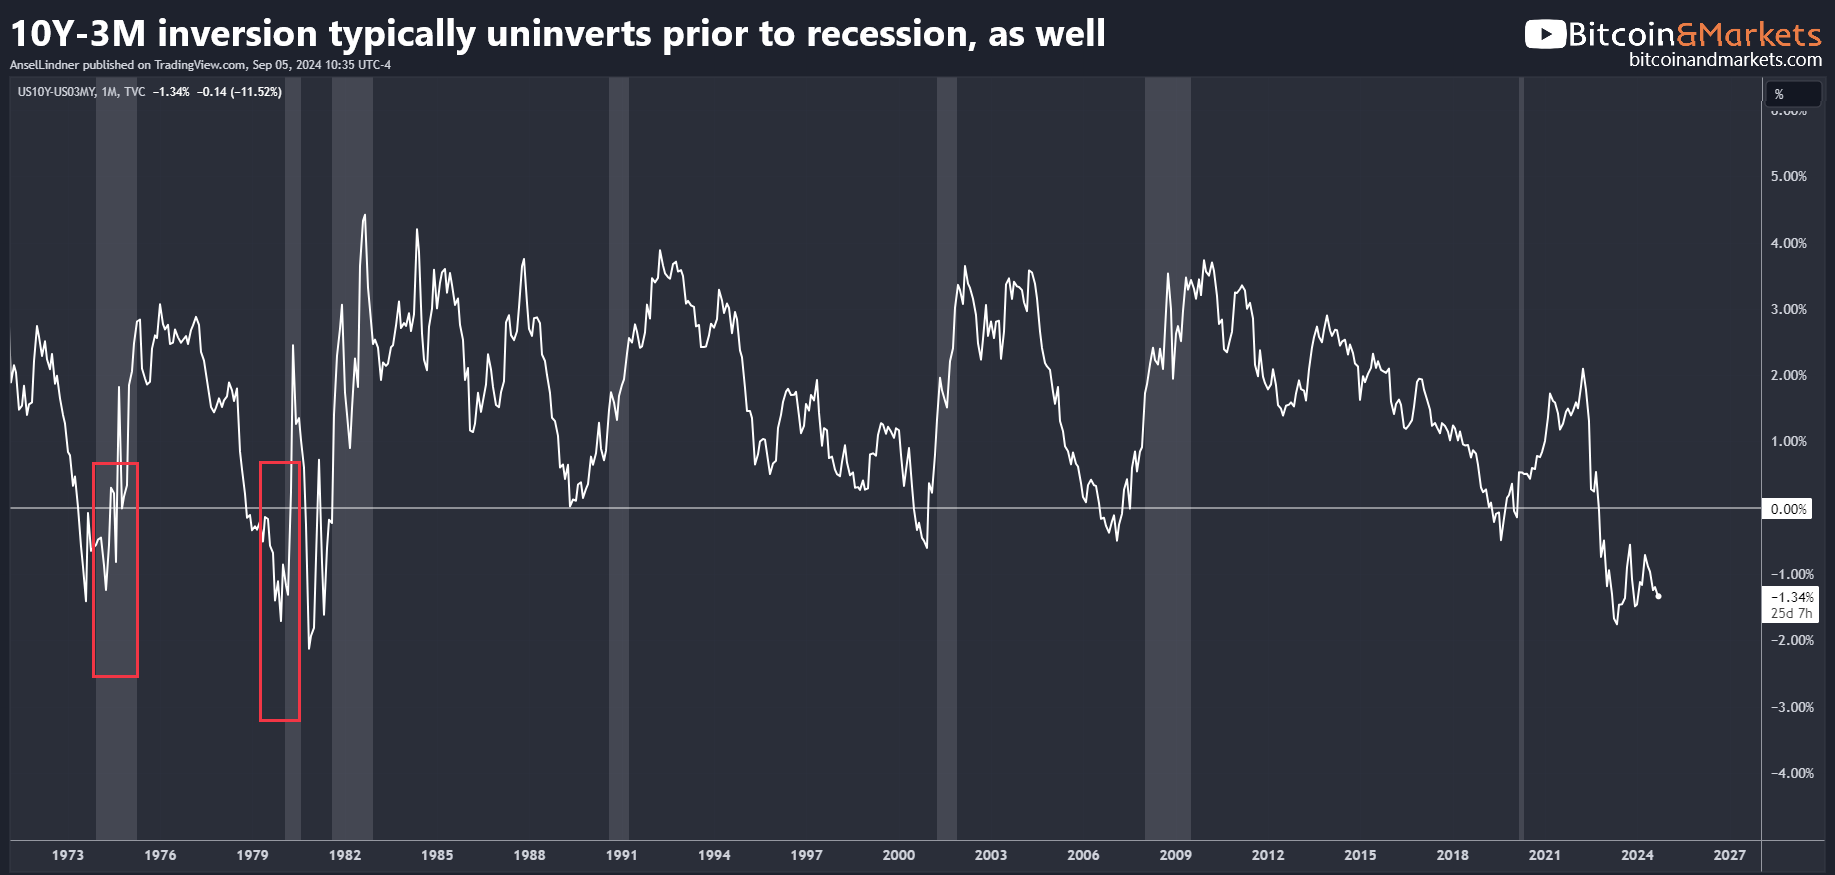
10Y-3M inversion remains
The 3M/10Y inversion remains significant. In modern times, the 3M/10Y un-inverted prior to a recession; however, it doesn't have to. Back in the '70s, this inversion lasted well into the official recession periods. If it begins to move in that direction, that would be enough for me to consider it a confirming recessionary signal.
The divergence between the 10Y-2Y and 10Y-3M yield curves reflects the market's differing expectations for short-term versus medium-term recession risk. In the short term, the 3M yield remains elevated because investors do not yet see an immediate risk of recession. However, over the next two years, recession risk is perceived to be nearly guaranteed, prompting an un-inversion of the 10-2Y.
This difference in expectations causes the 10Y-2Y curve to potentially un-invert while the 10Y-3M curve stays deeply inverted, signaling near-term hope but increased medium-term risk. The 10Y-3M should begin to move toward un-inversion as the Fed begins rate cuts this month.
Conclusion
The yield curve signals are pointing toward an imminent recession, with both the 2Y-10Y and 10Y-3M curves indicating economic weakness ahead. Investors should prepare for market shifts and consider adjusting portfolios to navigate potential downturns effectively. Understanding these indicators can provide a strategic edge in uncertain times. More to come for our Professional members.
Hope this helps someone.
Your support is crucial in helping us grow and spread my unique message. Please consider donating via Strike or Cash App or becoming a member today and get more critical insights!
Follow me on X @AnselLindner.
LIMITED TIME!
50%-off FIRST MONTH!
Support independent Bitcoin and Macro analysis!

Hold strong and have a great day,
Ansel
- Were you forwarded this post? You can subscribe here.
- Please SHARE with others who might like it!
- Join our Telegram community
- Also available on Substack.
Disclaimer: The content of Bitcoin & Markets shall not be construed as tax, legal or financial advice. Do you own research.


