Macro Minute: Reliable Recession Signals to Anchor Your Forecasts
Yield curve inversions, steepening, and employment data provide highly reliable signals to guide recession forecasts and avoid flip-flopping.


I cannot provide this important Bitcoin and Macro analysis without you.
Bitcoin & Markets is enabled by readers like you!
Signs of recession continue to build. There is a lot of confusion and flip-flopping among macro analysts and pundits regarding whether we’re heading for a hard landing, soft landing, or no landing at all. I wanted to share a couple of solid metrics you can use as reliable data points to maintain a consistent view of the market.
Yield Curve Inversions
The first is the yield curve. An inverted yield curve is when the yield of long-term bonds are below shorter term bonds or bills. Typically, if you are lending your money to someone for a longer period of time, you will demand a higher interest rate on that loan. If the short-term rate is above the long-term rate, it means there is something in the economy that is creating this unusual situation.
The main driver behind an inversion is investor expectations of an economic slowdown, which increase demand for long-term bonds. This inversion reshapes the financial structure, particularly for banks. Banks prefer to lend long-term at higher rates and fund these loans with short-term borrowing at lower rates to profit from the positive spread. However, inversions disrupt this model, and banks’ profitability and stability can weaken as a result.
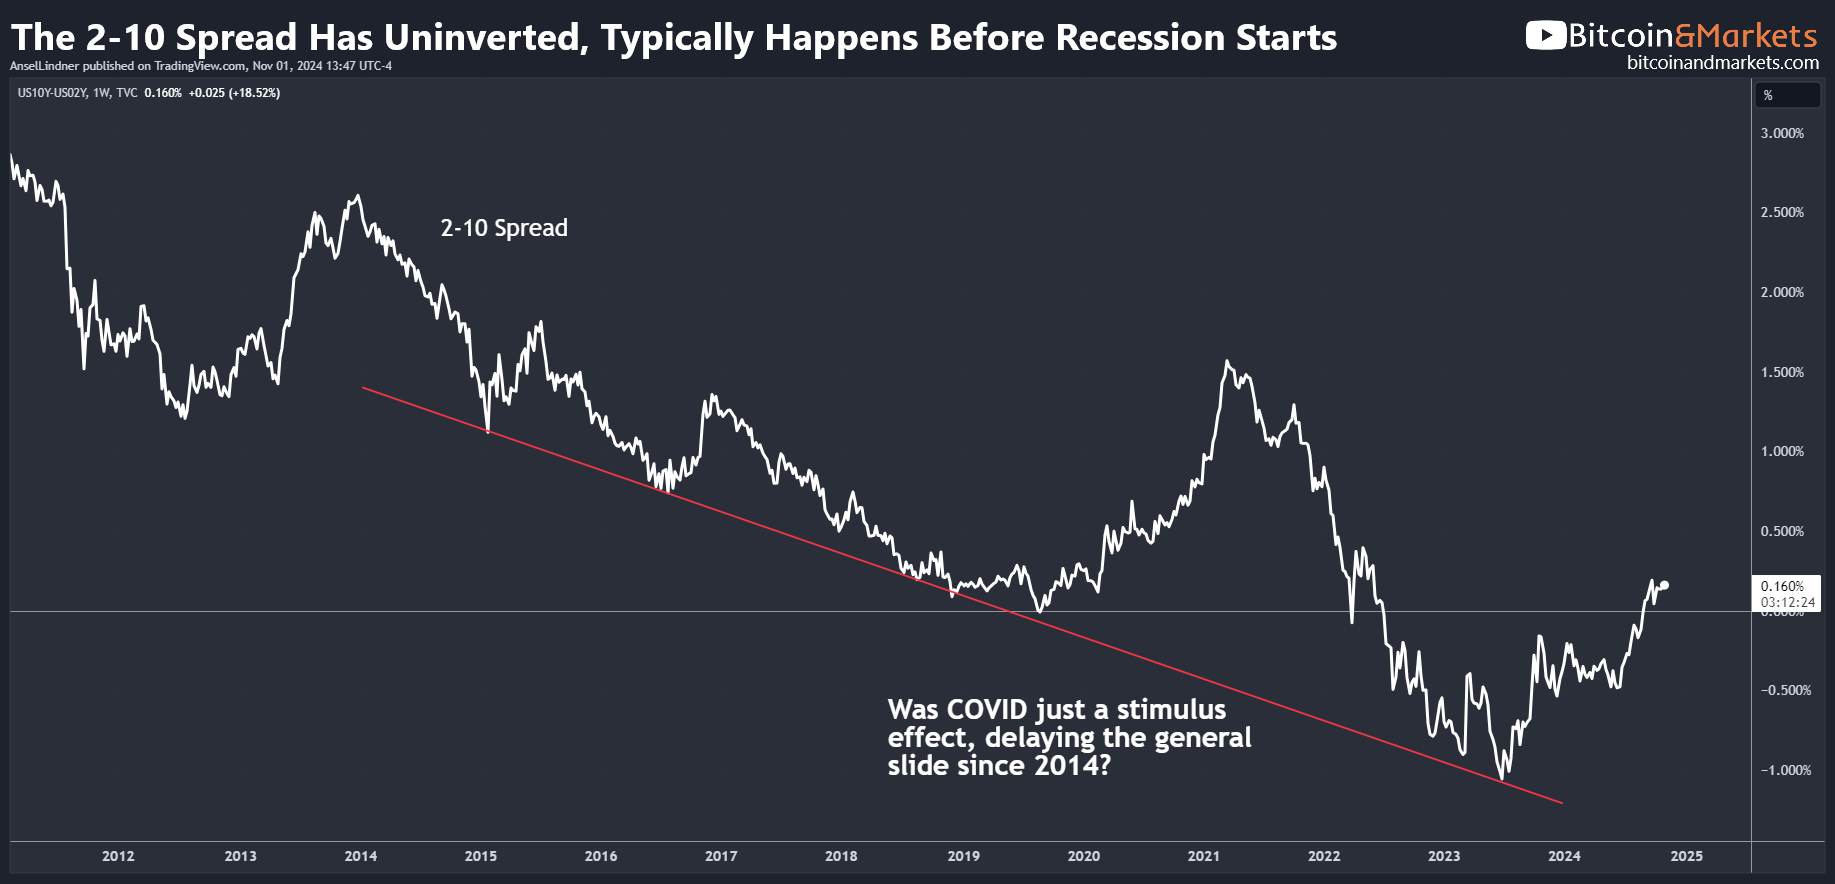
In this chart, I included the red trend line to show the COVID-era recovery as only a temporary effect of stimulus. Without it, the market might have entered a deep recession in 2021 anyway, and the COVID response merely kicked the can down the road a couple years.
The inversion process is important to understand, because while the central bank may have influence over short-term rates, long-term rates are controlled by the market. That means central bank guidance and their attempts to influence the market are limited. Long bonds will call the central bank's bluff, like we’ve witnessed over the last few years.
In an inversion, banks' ability to finance their operations is impaired. Slowly their financial position deteriorates and it can lead to a financial crisis.
As the economy deteriorates, banks' balance sheets become more precarious, and recession nears. The short end of the curve begins to fall as market participants begin to move in there as participants seek higher quality collateral. The central bank, reacting to this data, will begin cutting rates, and eventually the curve will un-invert before the recession is officially declared.
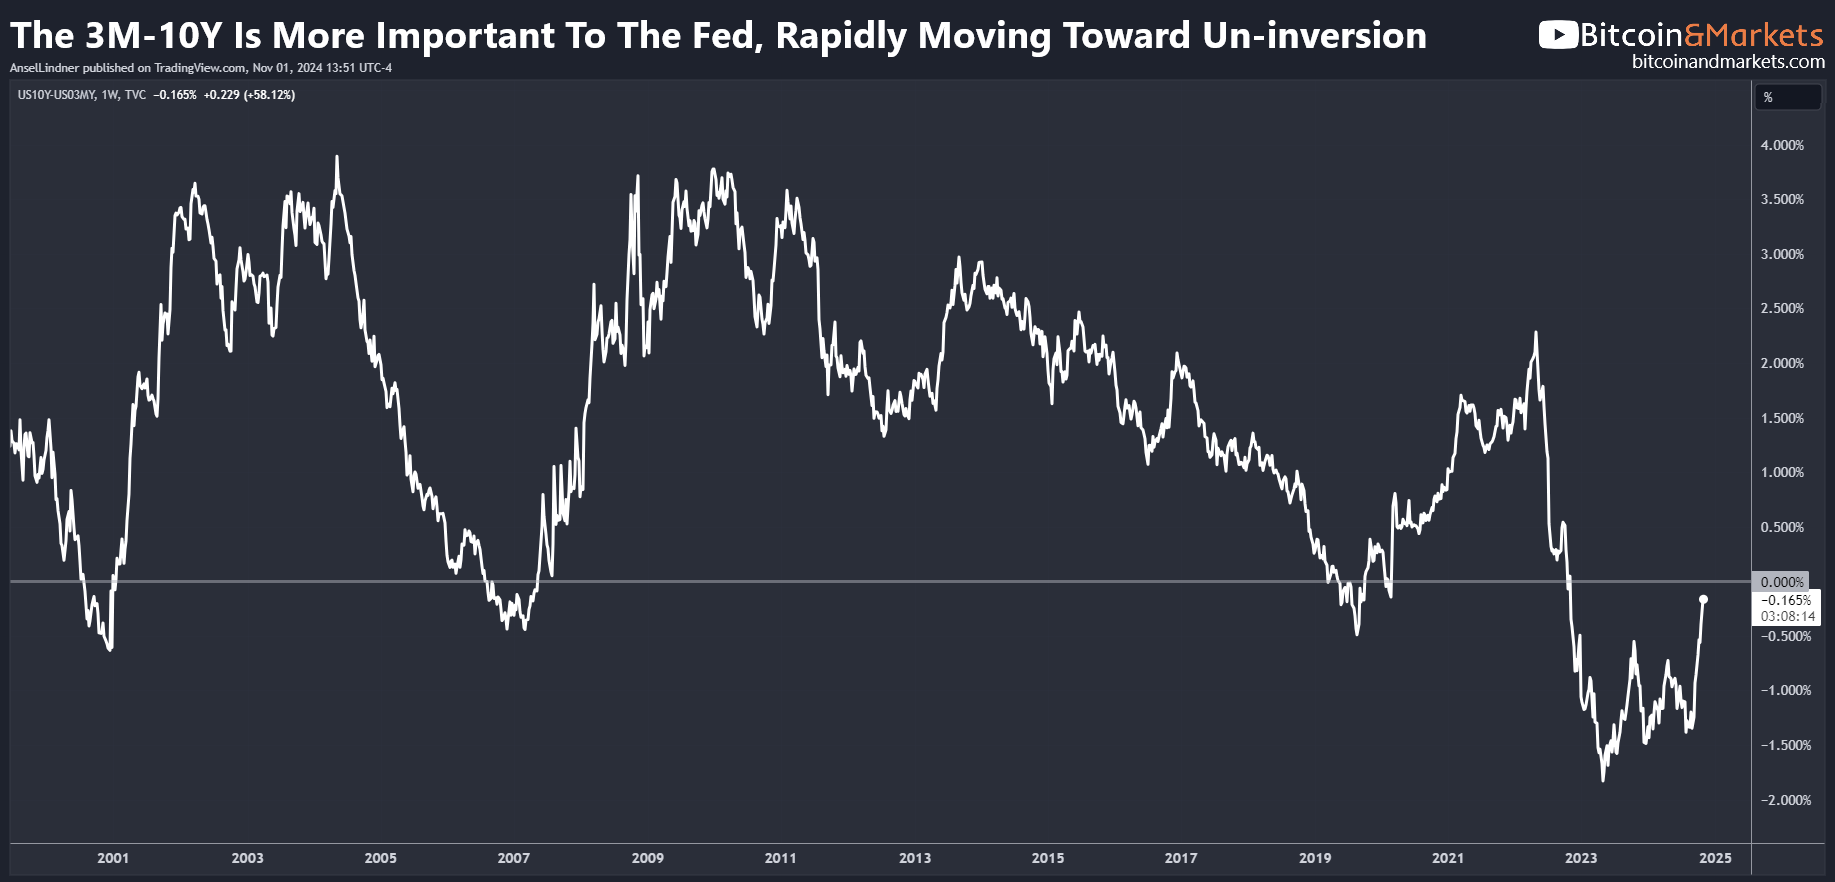
In the chart above, we see the 3-month/10-year spread, which Chair Powell and others regard as more significant than the 2-10 spread often discussed in media. This spread hasn’t yet un-inverted, but it’s certainly moving in that direction.
With all the attention on the 10Y yield over the last couple of weeks, the 3-month yield has told us that the typical information a rising 10Y might give us, like positive growth and inflation, is not the full story. If growth and inflation were accelerating, we’d expect the 3-month yield to rise as well.
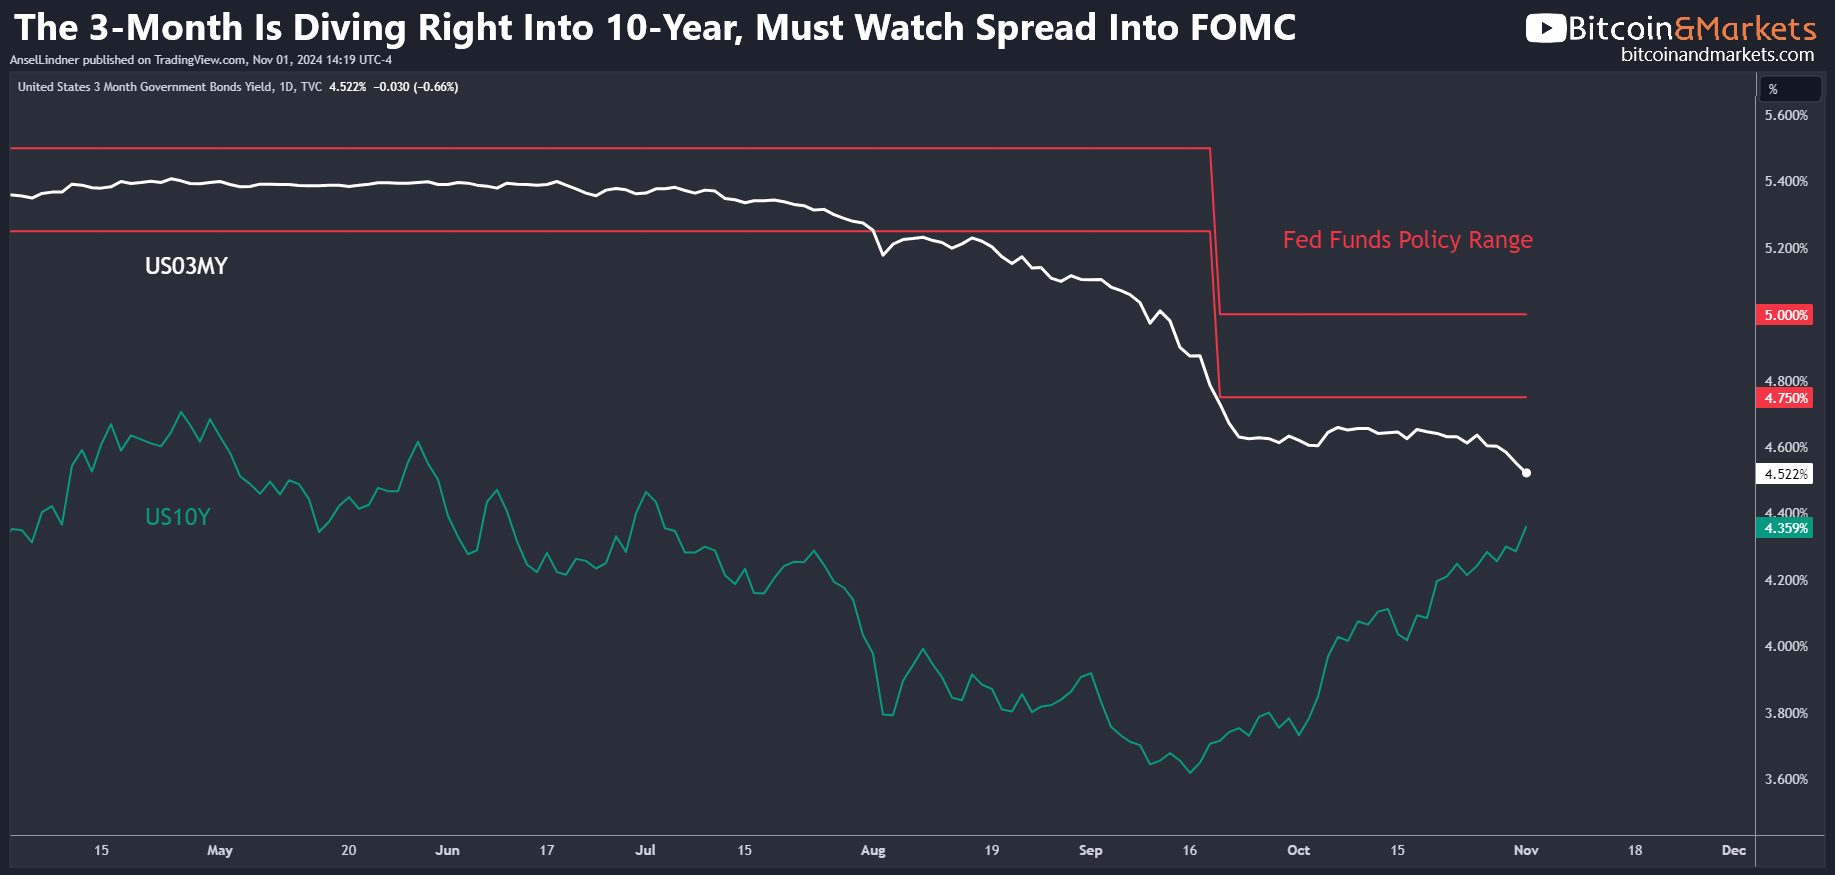
The yield curve remains a straightforward but powerful indicator that should not be second-guessed as a baseline.
Payrolls, Employment and the Sahm Rule
Moving into recession, we expect employment to show signs of stress. This morning the US released the Non-Farm Payroll data, which was a blow to those predicting inflation and economic reacceleration.
October payrolls increased by only 12,000, far short of the 100,000 expected—a 3-sigma miss and the lowest monthly gain since 2020. Additionally, September and August numbers were revised downward, with September dropping from 254,000 to 223,000 (a 31,000 difference) and August from 159,000 to 78,000 (an 81,000 difference).
Notice the trend in the chart below, extending back three years. The employment picture in the US has been slowly deteriorating during that entire time.
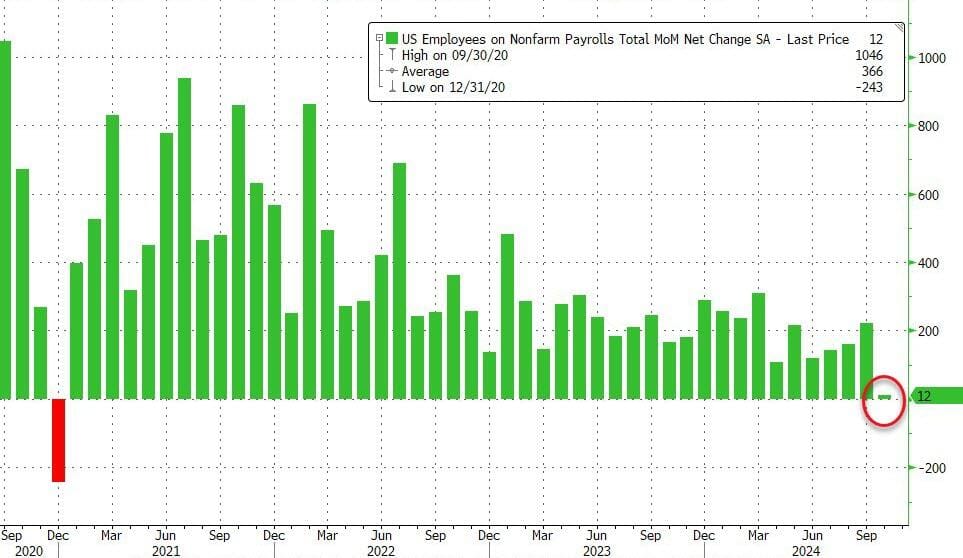
With all the downward revisions this year, we can be almost certain that October’s numbers will also be revised lower next month, likely turning negative.
In the Establishment Survey, non-farm payrolls don’t factor into the unemployment rate, but the Household Survey is likely to reflect similar changes, which would lead to a notable increase in unemployment when released.
Another employment indicator to to help maintain a consistent market outlook is the Sahm Rule. This is a real-time economic indicator to assess whether the economy is in or approaching a recession. It triggers when the three-month moving average of the unemployment rate rises by 0.5 percentage points or more from the lowest three-month average within the past year.
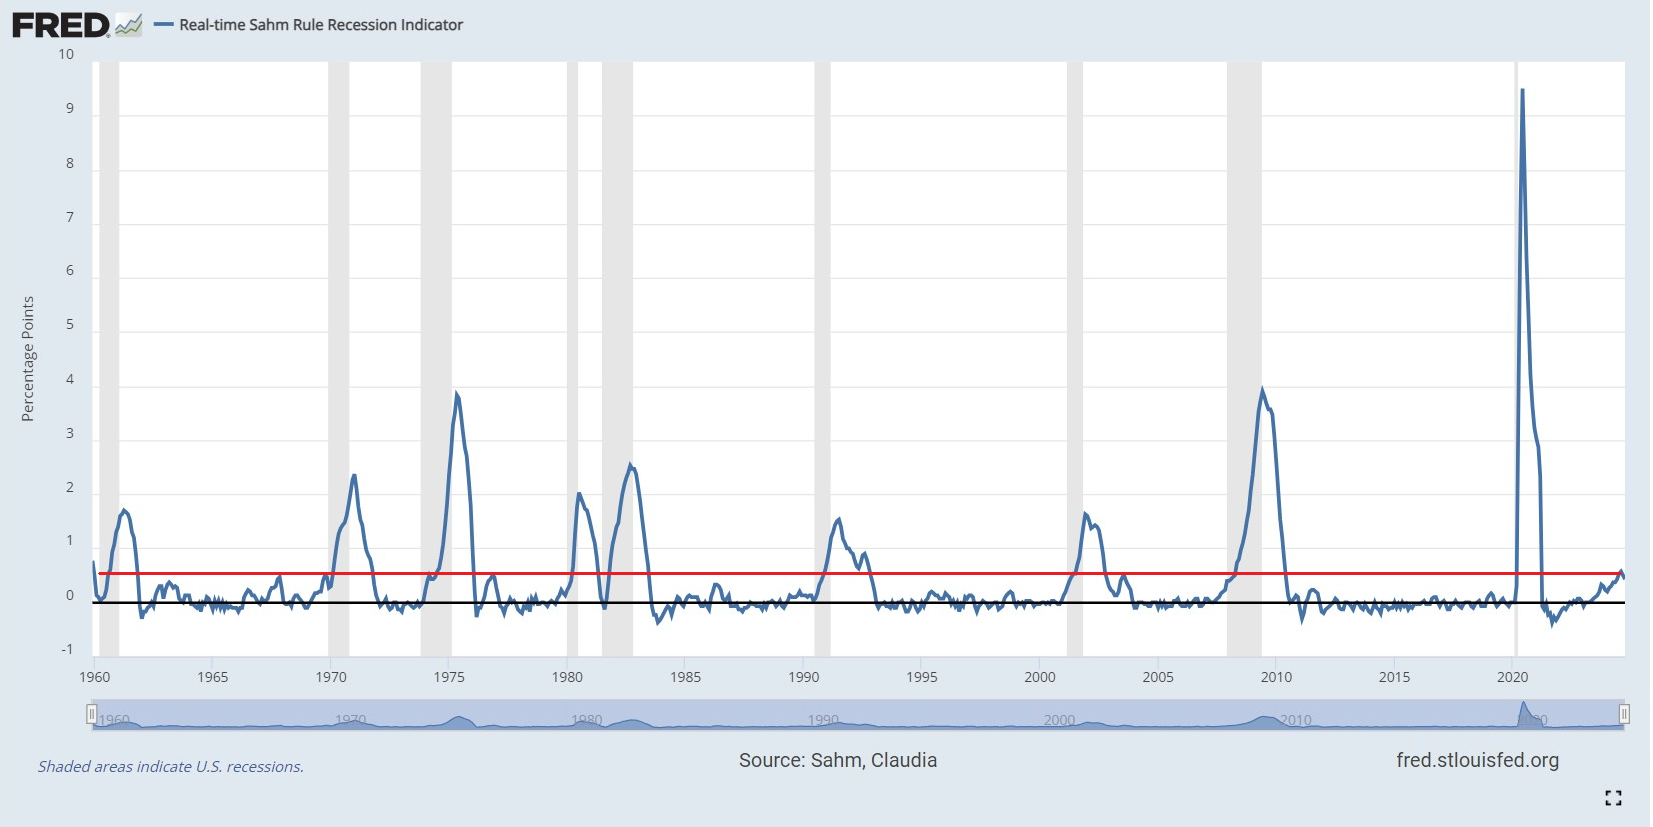
Although this year's unemployment data has been bumpy due to many revisions, the Sahm Rule is clearly a highly reliable indicator. Contradicting the Sahm Rule with your base case for the economy is not likely to end well.
Hope this helps someone.
Your support is crucial in helping us grow and spread my unique message. Please consider donating via Strike or Cash App or becoming a member today and get more critical insights!
Follow me on X @AnselLindner.
I cannot provide this important Bitcoin and Macro analysis without you.
Bitcoin & Markets is enabled by readers like you!
Hold strong and have a great day,
Ansel
- Were you forwarded this post? You can subscribe here.
- Please SHARE with others who might like it!
- Join our Telegram community
- Also available on Substack.
Disclaimer: The content of Bitcoin & Markets shall not be construed as tax, legal or financial advice. Do you own research.


