Macro Minute: More Signs of Recession, 5y5y Forward and Breakevens
How the 5Y5Y Forward and breakevens reveal transitory inflation and signal a looming recession through market inversions.


I cannot provide this important Bitcoin and Macro analysis without you.
Bitcoin & Markets is enabled by readers like you!
5-Year, 5-Year Forward
The 5Y5Y Forward is considered one of the most reliable indicators for inflation expectations. Important to note: this refers to expectations of money printing, not necessarily CPI expectations.
This metric, in particular, helped me predict that inflation would be transitory, because after the COVID crash, it never reached significant levels. Even the moderate CPI years after the Global Financial Crisis (GFC) were higher. Therefore, there wasn't enough money printing to sustain higher prices in the last couple years, and the economy would inevitably slide into recession and to lower prices again.
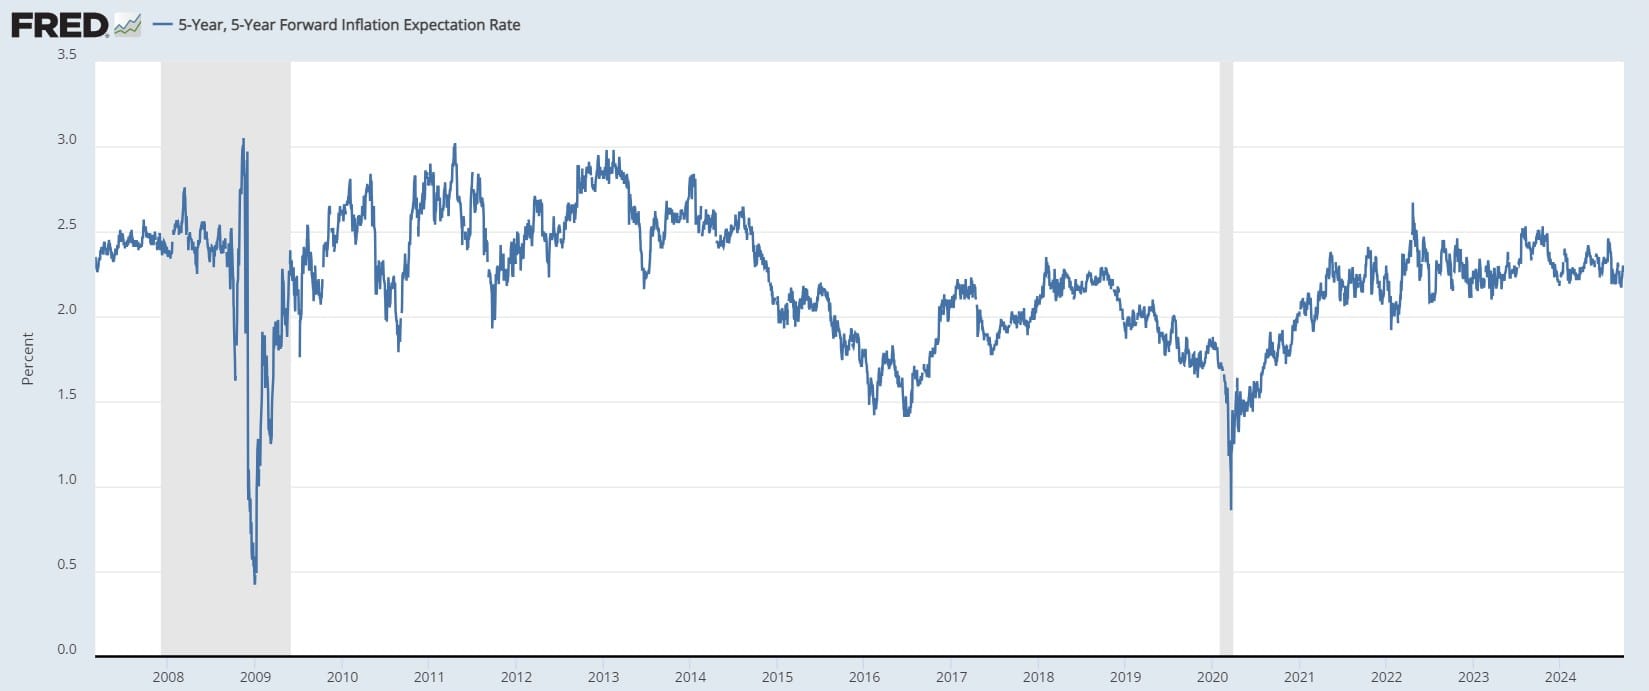
Just to clarify, the 5Y5Y Forward measures the market's expectations for inflation starting five years from today and continuing out to ten years.
Breakevens
Breakevens measure something slightly different but are still among the best gauges of inflation (i.e., money printing).
The breakeven inflation rate represents a measure of expected inflation derived from comparing Treasury Constant Maturity Securities (standard) and Treasury Inflation-Protected Securities (TIPS) of the same duration.
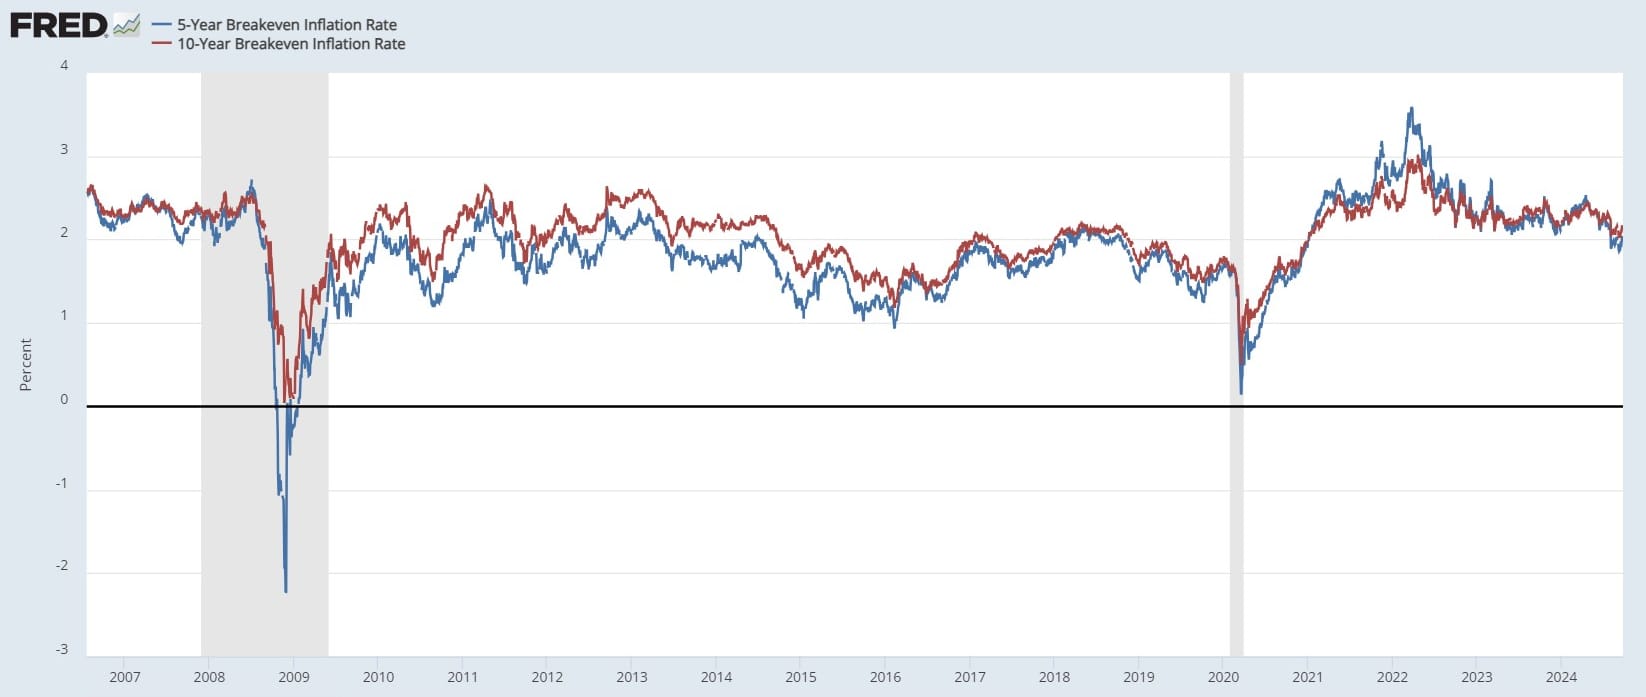
As you can see above, the normal behavior is for the 10-year breakeven to be above the 5-year. However, there are periods of inversion, as highlighted in the chart below. A brief inversion spike preceded the crash during the GFC.
The post-COVID crash behavior was particularly notable, with the breakevens rapidly inverting and sustaining that inversion for two years. This should have signaled that something was seriously wrong with the economy, and the "recovery" was hiding a future downturn. Indeed, this confirmed my transitory CPI call and interpretation of the 5Y5Y Forward above.
I've also added the Fed Funds Effective Rate to the chart below and focused on the period leading up to the GFC. While I would have liked to use the policy rate, the current practice of using an upper and lower bound was initiated after the GFC.
There was a significant period of inversion years before the GFC, notably in 2004 and 2005 during the rate hiking cycle. The inversion then tightened for a couple of years and eventually un-inverted as both breakevens gently declined—the market slowly realized that a downturn was ahead. It wasn't until September 2007 that then-Chairman Ben Bernanke cut the policy rate by 50 bps.
I can't help but notice the parallels between pre-GFC breakeven behavior and today. We had two years of inversion, followed by tightening and un-inversion, and now the Fed has delivered its first rate cut of 50 bps.
History doesn't repeat, but it rhymes. This is yet another indicator signaling a coming recession. It also highlights the disconnect between what most people call "inflation" and actual inflation (i.e., money printing). Despite all the stimulus post-GFC and particularly after COVID, the economy has not recovered or restarted normal credit-based monetary functioning.
Hope this helps someone.
Your support is crucial in helping us grow and spread my unique message. Please consider donating via Strike or Cash App or becoming a member today and get more critical insights!
Follow me on X @AnselLindner.
I cannot provide this important Bitcoin and Macro analysis without you.
Bitcoin & Markets is enabled by readers like you!

Hold strong and have a great day,
Ansel
- Were you forwarded this post? You can subscribe here.
- Please SHARE with others who might like it!
- Join our Telegram community
- Also available on Substack.
Disclaimer: The content of Bitcoin & Markets shall not be construed as tax, legal or financial advice. Do you own research.