Bitcoin Fundamentals Report #318
MSTR joins Nasdaq, FASB accounting rule changes, global Bitcoin reserve news, and expert price analysis in our comprehensive newsletter


December 16, 2024 | Block 875,059
Quick Navigation: Headlines | Macro | Price Analysis | Mining | Layer 2 | Previous Posts

I cannot provide this important Bitcoin and Macro analysis without you.
Bitcoin & Markets is enabled by readers like you!
Snapshot of Bitcoin
| General Bitcoin | |
| Weekly trend | Breakout |
| Media sentiment | Very Positive |
| Network traffic | Steady |
| Mining industry | Expanding |
| Price Section | |
| Weekly price* | $105,783 (+$9,136, +9.5%) |
| Market cap | $2.095 trillion |
| Satoshis/$1 USD | 945 |
| 1 finney (1/10,000 btc) | $10.56 |
| Mining Sector | |
| Previous difficulty adjustment | +4.4294% |
| Next estimated adjustment | -1% in ~13 days |
| Mempool | 113MB |
| Fees for next block (sats/byte) | $0.74 (5 s/vb) |
| Low Priority fee | $0.74 |
| Lightning Network** | |
| Capacity | 5086.06 btc (-1.9%, -99) |
| Channels | 46,121 (-0.5%, -231) |

MicroStrategy Continues to Accumulate Bitcoin
MicroStrategy has acquired 15,350 BTC for ~$1.5 billion at ~$100,386 per #bitcoin and has achieved BTC Yield of 46.4% QTD and 72.4% YTD. As of 12/15/2024, we hodl 439,000 $BTC acquired for ~$27.1 billion at ~$61,725 per bitcoin. $MSTR https://t.co/SaWLNBVkrl
— Michael Saylor⚡️ (@saylor) December 16, 2024
MicroStrategy Added to Nasdaq 100
This is a huge development, because of the passive flows that will now enter the MSTR stock. As we all know, investing in index funds like QQQ is very popular, both with active and passive retirement investors. As money comes in, it is apportioned by market cap. So, some money goes into buying each stock. This will add passive daily buyers to MSTR stock.
In addition, MSTR will have to be bought by QQQ for it's initial weighting, whish is starting at roughly 0.43% of the index.
Theoretically, this move will allow MSTR to issue more shares and buy bitcoin with it. Instead of being dilutive, this action is actually accretive. Meaning that each time MSTR sells shares at a premium, they can turn those new shares into extra bitcoin. Or they can raise more cash than the bitcoin diluted. After each time they issue more shares, each share represents MORE bitcoin. This continues until the premium disappears, but with so many new buyers from the Nasdaq, the premium is even more secure now.
Martin Shkreli Shorts Michael Saylor
This is pretty funny. I think Martin Shkreli is a very smart guy, but he is doing ad hominem investing here. He is shorting MSTR, a slightly levered BTC play, because Michael Saylor is off-putting.
FASB Accounting Rule Change for Bitcoin
The Financial Accounting Standards Board (FASB) has introduced new guidelines requiring companies to measure bitcoin assets at market value on their balance sheets. These rules are effective for fiscal years beginning after December 15, 2024, with early adoption permitted.
Previously, companies accounted for bitcoin as indefinite-lived intangible assets, recording them at historical cost less impairment. This approach only recognized decreases in value, not allowing for adjustments when the asset's value increased. The new standard mandates that these assets be measured at fair value, with changes reflected in net income each reporting period.
The ability to reflect both increases and decreases in the value of bitcoin may encourage more companies to have a bitcoin strategy and hold it on their balance sheets.

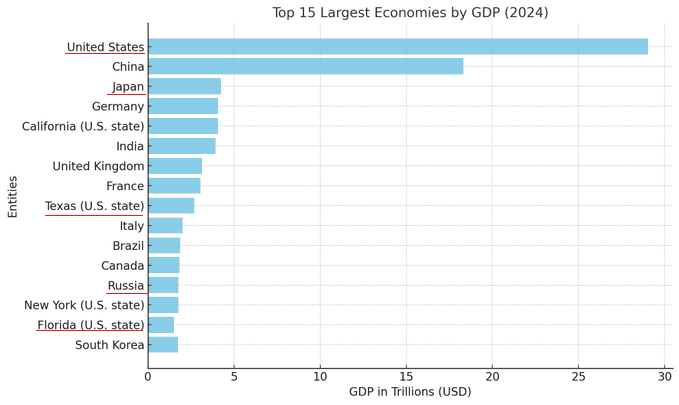
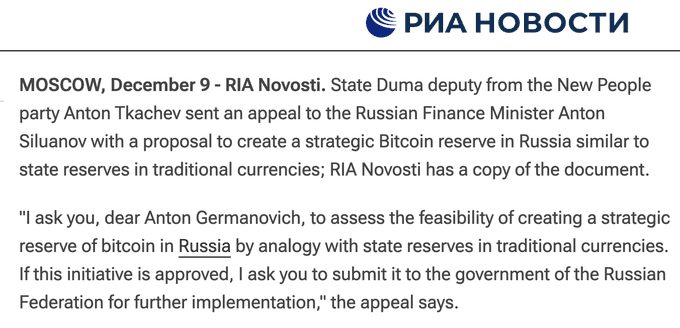
Russia, Japan and Texas All Have Bitcoin Reserve Bills Introduced
The Overton Window is smashed wide open. The red underlined economies have or are debating starting a bitcoin reserve. Perhaps, in 2025, a majority of global GDP will be backed by a bitcoin reserve.

Trump Confirms Bitcoin Reserve Plans
Not to be left out of the headlines, Trump confirms bitcoin reserve plans in a brief interview with Jim Cramer. "We're gonna do something great with crypto because we don't want China or anybody else - not just China but others are embracing it - and we want to be the head."
Macro
CPI Hotter than Expected
November CPI was released last Wednesday and came in
- Headline: 0.31% vs 0.26% expected
- Core: 0.31% vs 0.27% expected
Of course, the instant CPI showed any small rise MoM, people go bananas about reacceleration. They also bring up the below chart repeatedly.

I've debunked this chart several times in the past, but let's do it one more time. Notice the different vertical axes above. The current CPI axis is the left, and the 1970's is on the right. That is not totally dishonest, because it is labeled, however, putting them on top of each other does build an expectation for our brains to find a pattern. When we sync them up onto the same axis, the relationship starts to disappear.
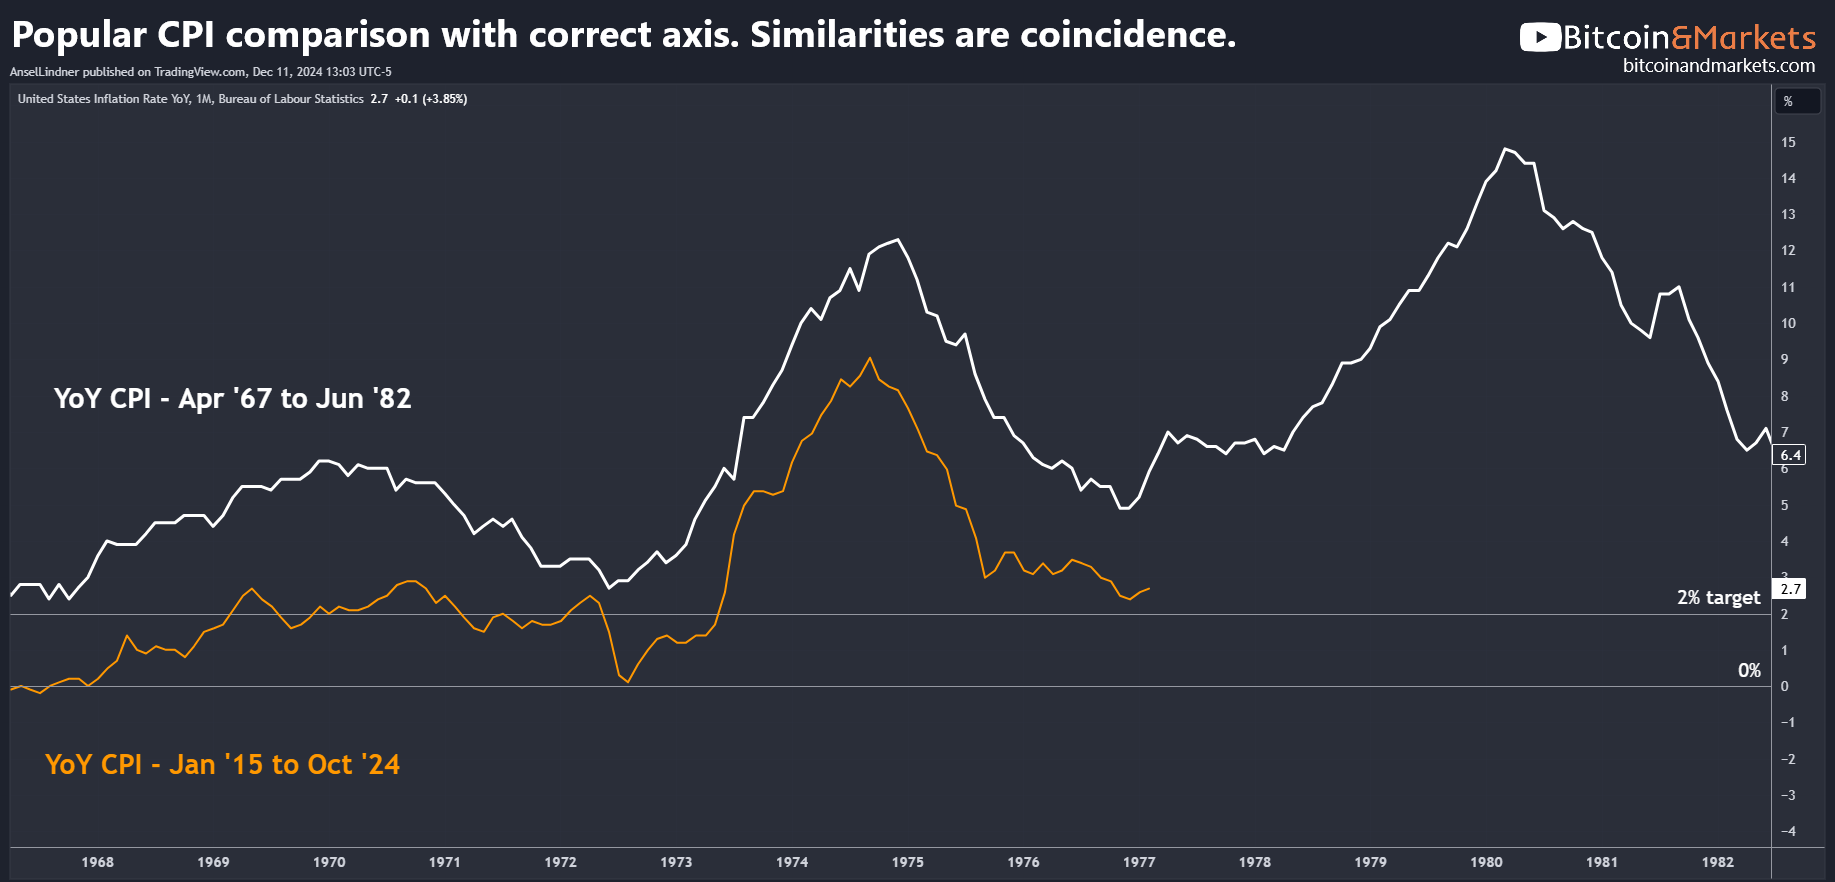
Above, notice the initial hump on the left, it virtually disappears for the current orange line. Look back up to the misleading chart, notice the blue line is flat there as well, but your brain makes you see a hump because of the overlapping of the lines. It was only the dip from COVID in 2020 that creates the appearance of a hump.
Below are the monthly readings compared for the same time frame. As you can see, the dip in COVID, the fast rise, then a fall back to zero. The white line from the 1970's is higher the whole time, and shows a slower rise and fall.
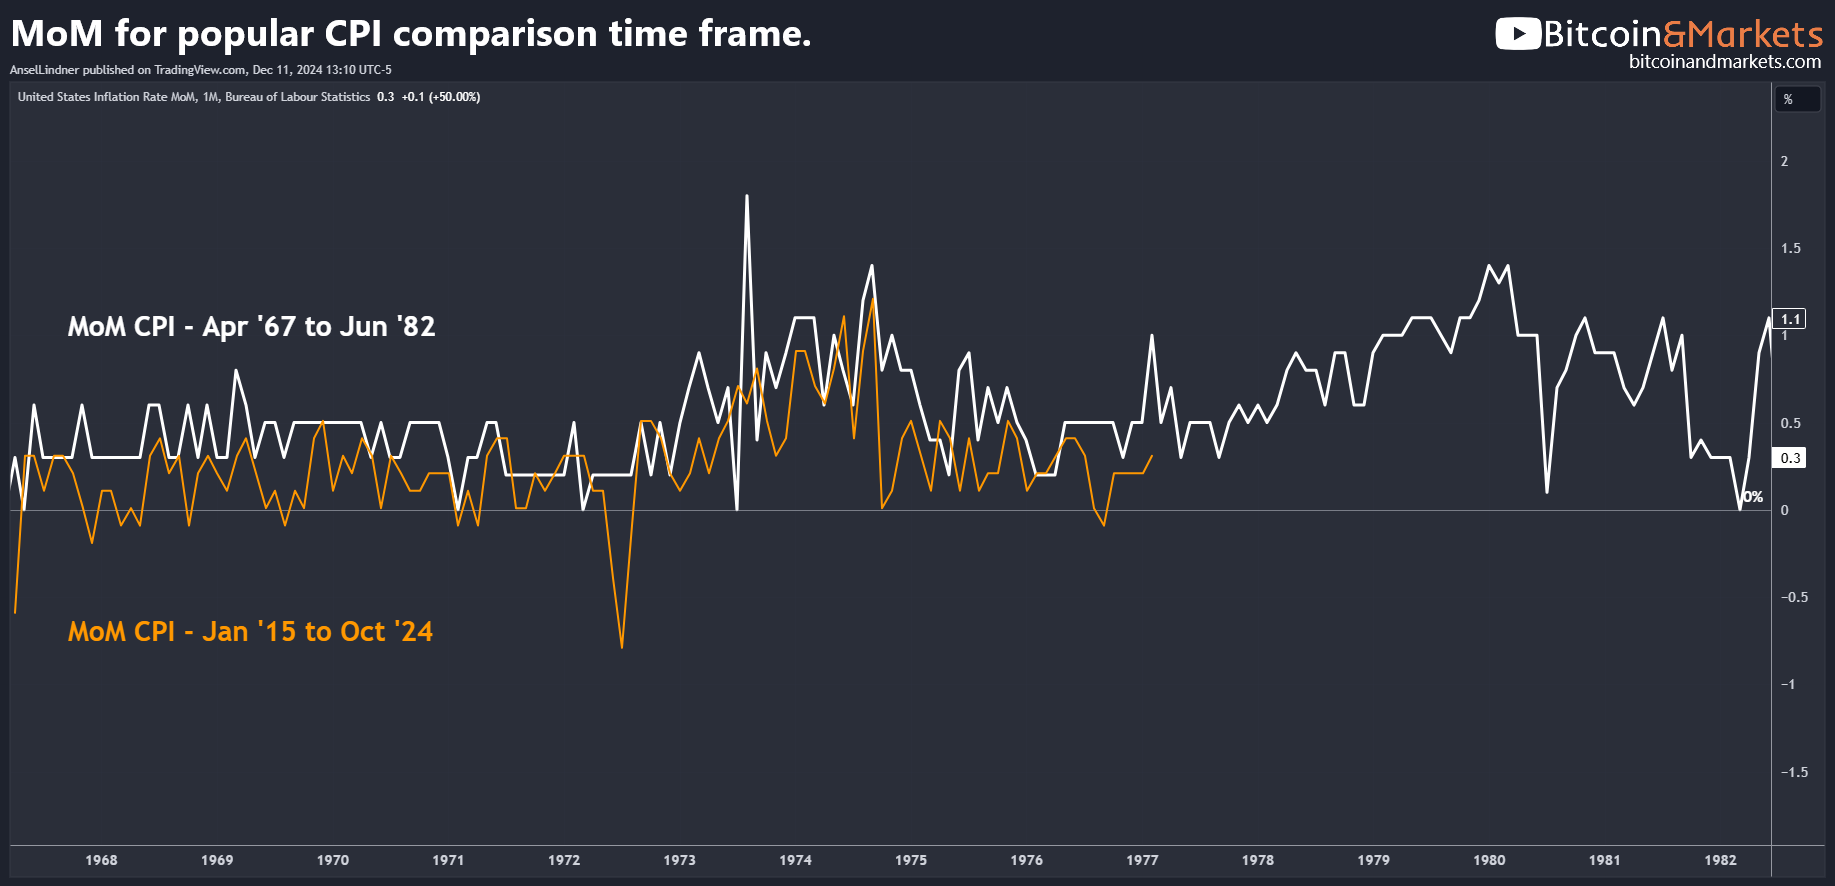
I'll leave it there. I just don't want my readers to bite off on calls for much higher inflation. We are heading into the recession part of the cycle, where CPI declines.
FOMC This Week, 25 bp Cut Priced In
We start the week in which the Federal Reserve will decide on their next move with the market pricing in a 99% chance of a 25 bp cut. That is the overwhelmingly likely outcome, with a slight chance of a 50 bp cut IMO.
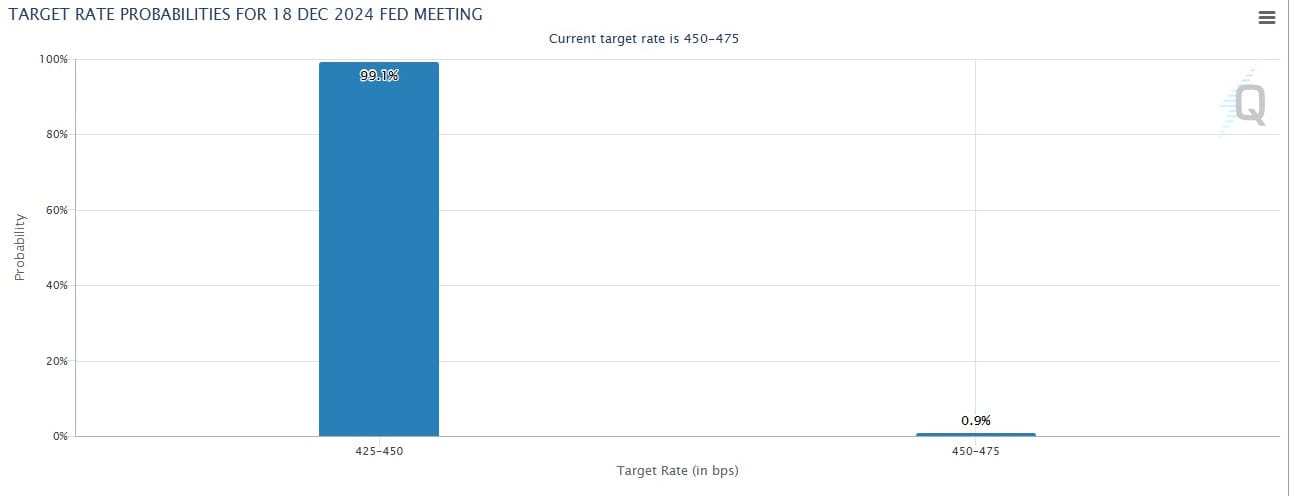
If Chair Powell does not cut, he is tacitly admitting to a policy error, and risks adding to uncertainty in the market. Despite all the bluster from the MSM and my opinions of the Fed not doing anything mechanical, I think the Fed is acting in good faith here. They are attempting to appear accommodative. Steady cuts portray confidence and they hope that will psychologically support the market.
Join me LIVE on Wednesday for the FOMC decision at 2pm ET!
Chinese Government Bond Yields Collapse

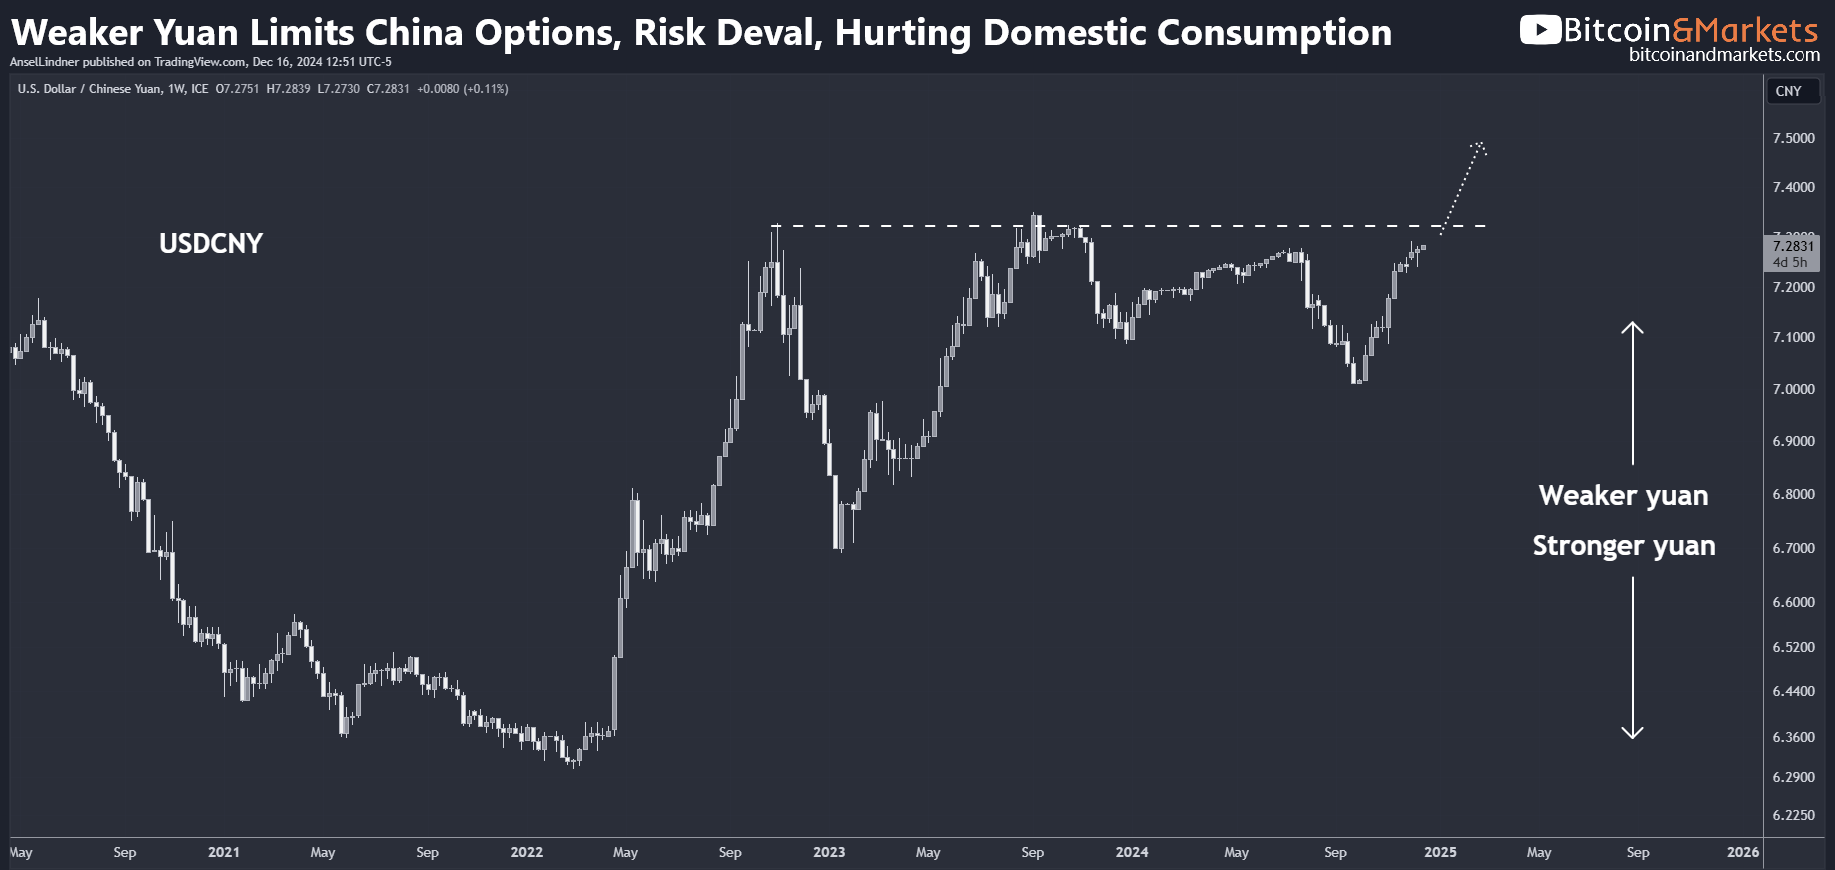
This is not how a healthy market behaves. The yields on Chinese government debt tell us something major is happening over there, despite the carefully managed reporting in their financial media.
We do hear about the unprecedented government stimulus that is being primed, but still don't have those plans in action yet. The reason for the delayed rollout is worry about their currency. If they do massive government fiscal stimulus, their currency will bear most of the cost.

Join the Professional tier to receive my MARKET PRO, price analysis and actionable forecast updates on Bitcoin and macroeconomic factors! Sign up today!
Bitcoin Charts
Last week:
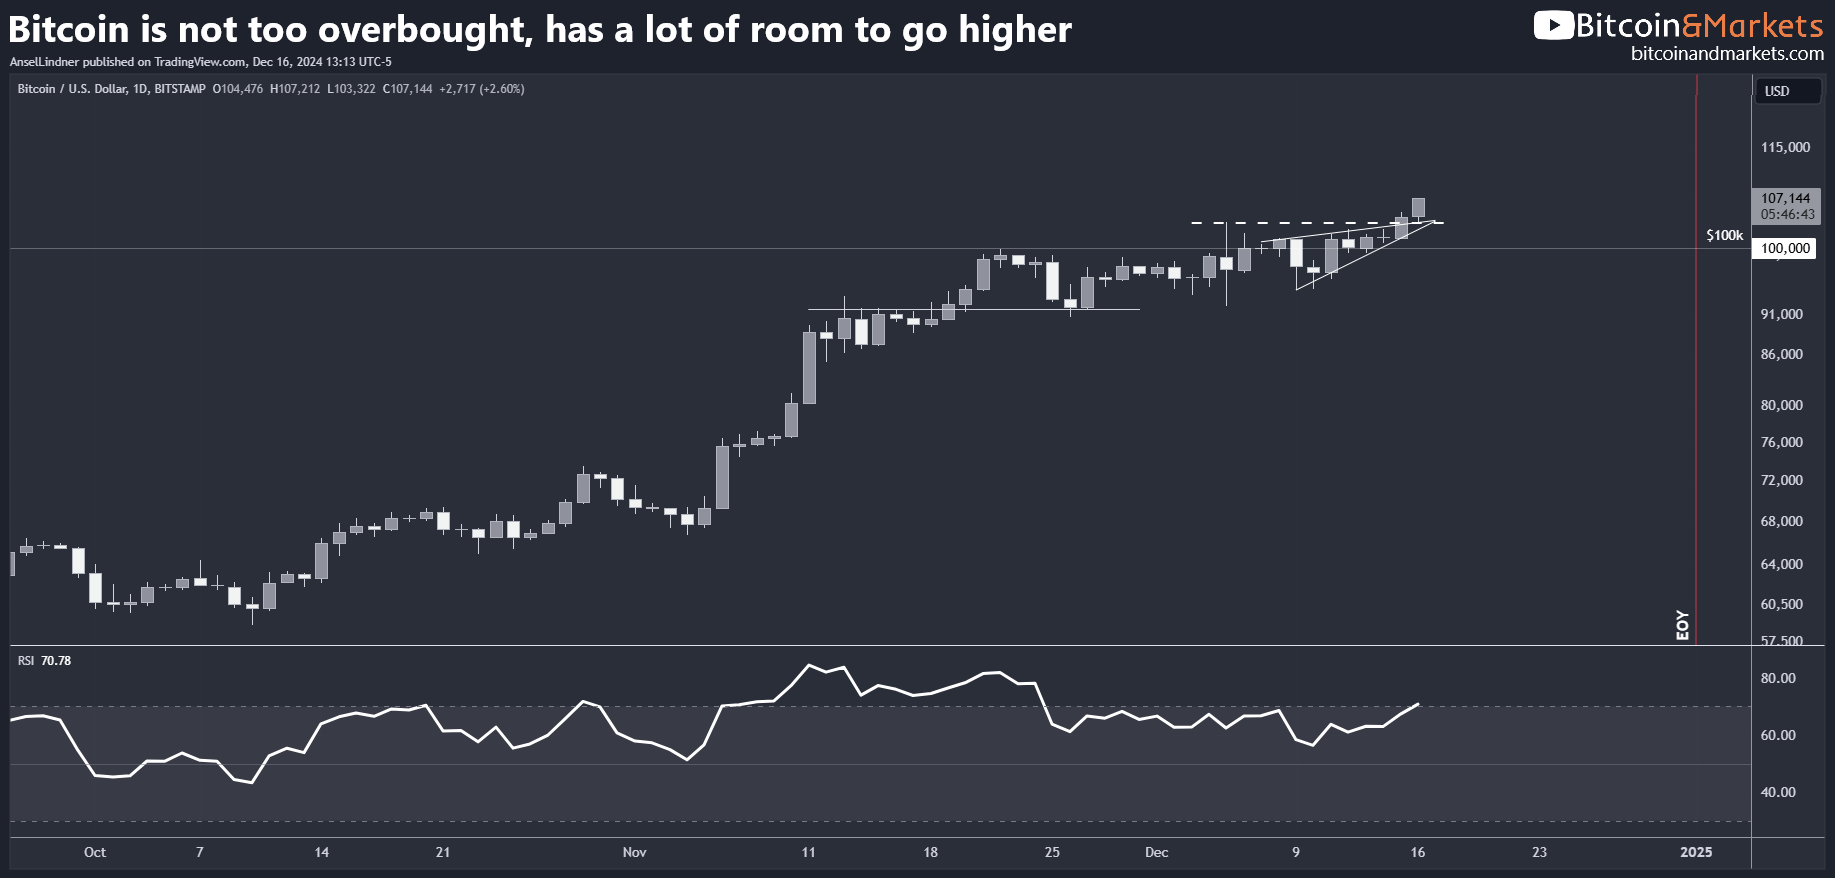
"My base case for this week remains consolidation sharing characteristics with the October 2023 pattern. While price has broken the $100k mark, we are waiting for price to really take off to the next higher range."
Happy Monday, we are currently beginning the next leg of this bull market. This will probably be the last time I use this pattern from Oct 2023. I simply use it here to show the earlier breakout relative to back then, just as predicted for weeks.
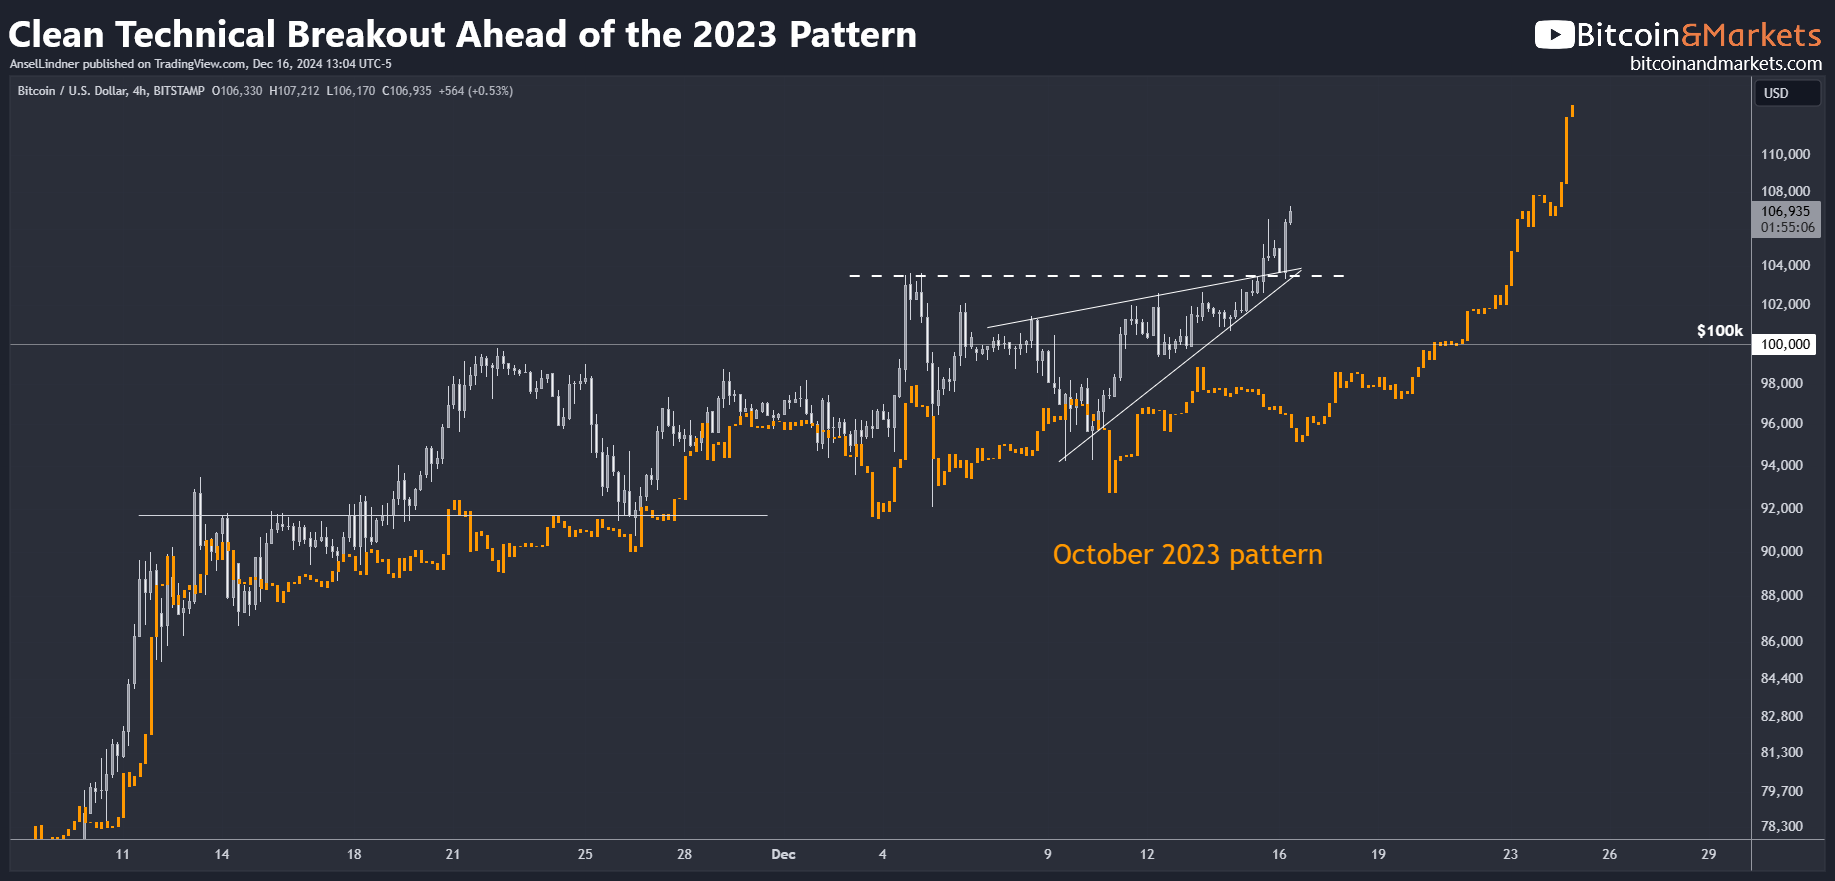
This was a very clean technical breakout, meaning, it made sense from a technical analysis perspective, with a rising wedge into the previous high, followed by a breakout and retest. Also, I have to say this because so many people claim there is manipulation of the price, but this is a very clean technical pattern with very little evidence of tampering.
There is potential resistance from this price channel. However, I do not think it will be significant since there are cleaner more impactful trend lines already broken.
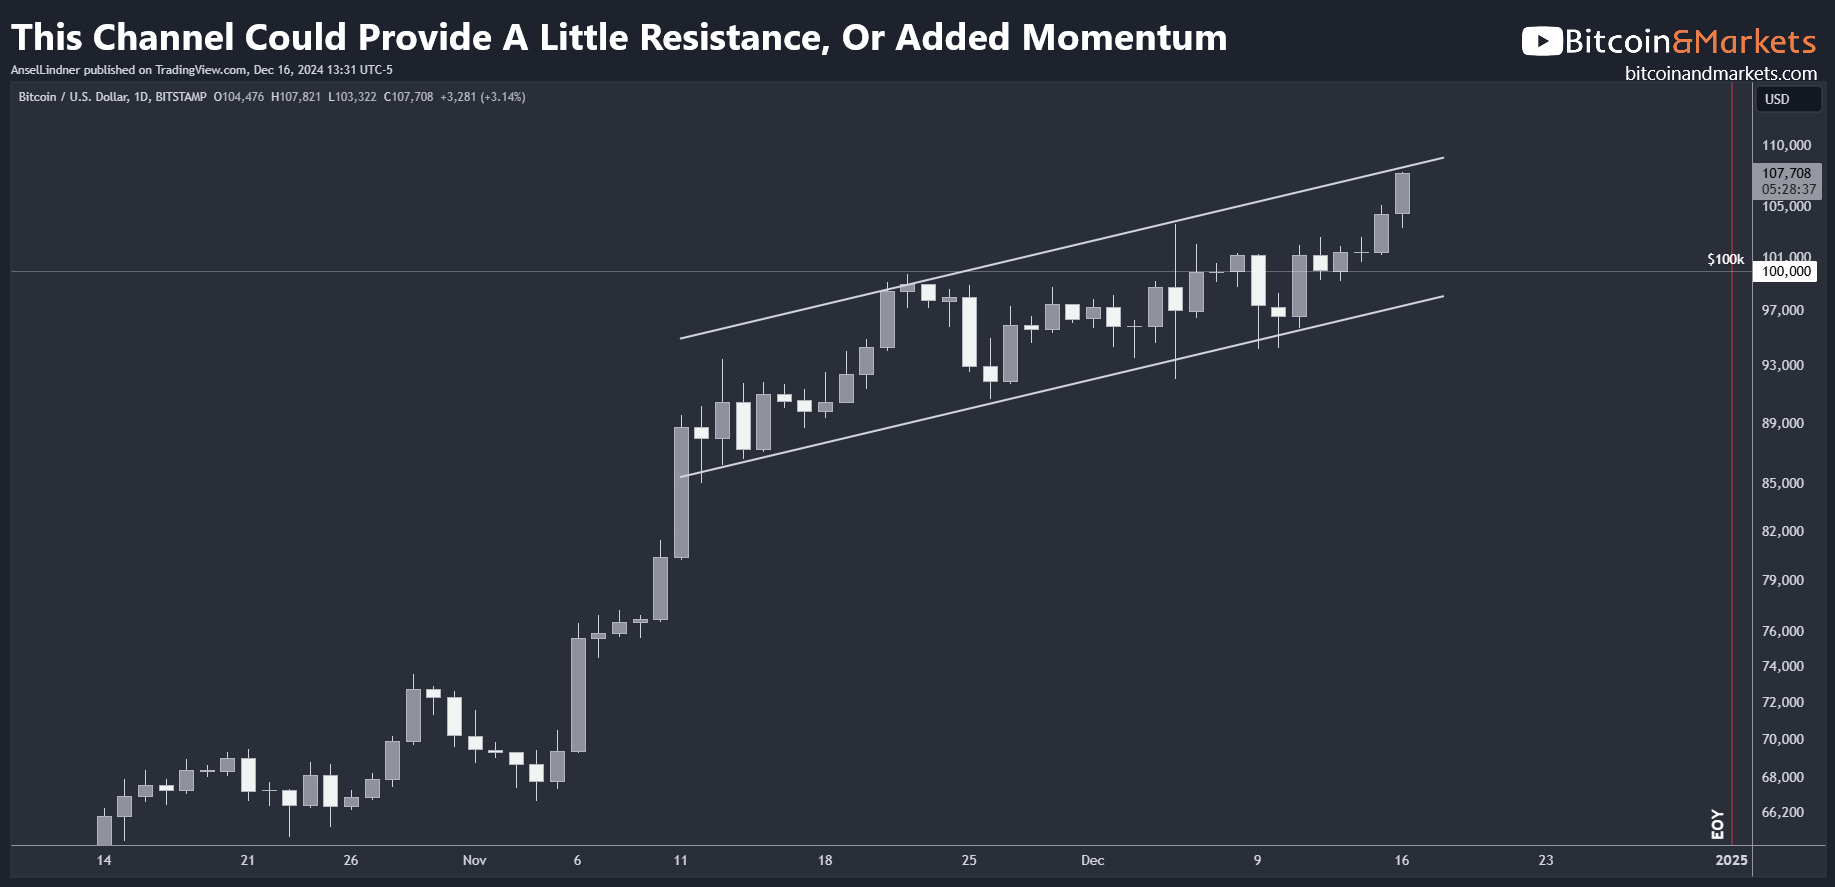
Bitcoin is not overbought on the daily RSI below, meaning it has room to rally another 10-20% or so, before any particular worry about the next slow down.
However, when we zoom out to the weekly chart, RSI is elevated. It is currently at 80, which is not an extreme, but should be considered elevated, resulting in an increased risk of a correction.
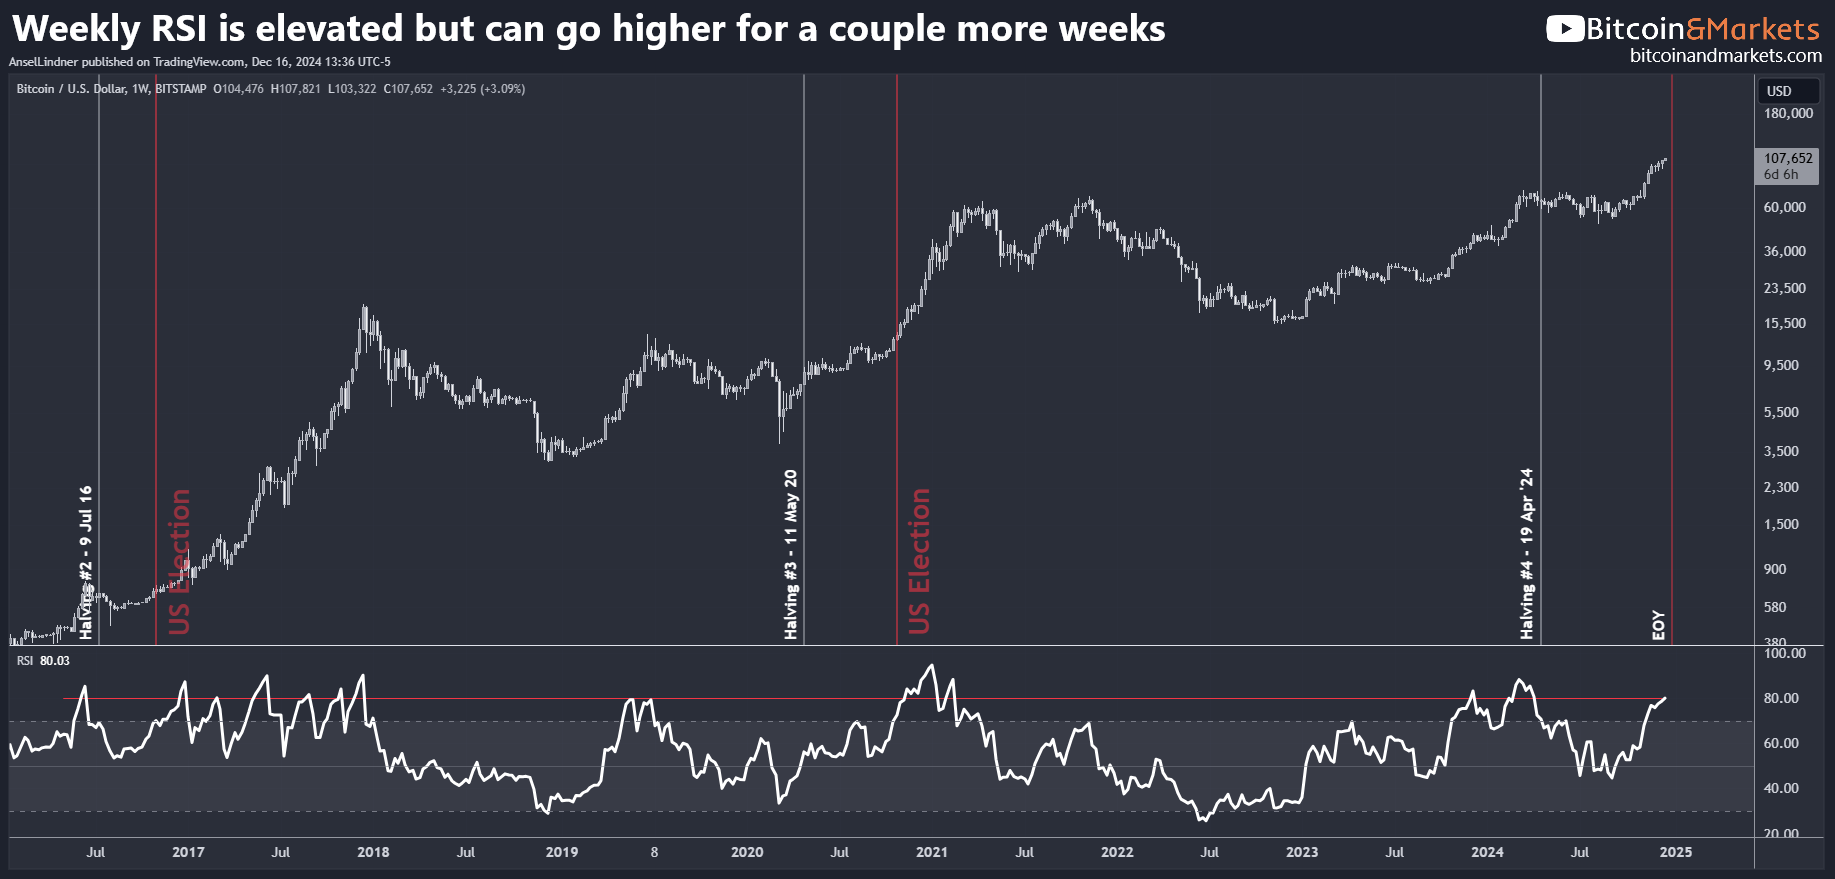
I think it is very unlikely for a single $100k-moon candle like other bitcoiners seem to think is possible. We will obey the technicals, just on the very bullish end of those technicals.
These factors taken together do give us a general timeline on this move. Given the room on the daily chart, and overbought conditions on the weekly chart, that timeline is at most 3-4 weeks until we have a significant correction allowing the weekly chart to cool down. This also aligns with the Trump inauguration on Jan 20th. I'm not implying bitcoin will crash, but with periods of big gains, comes periods of rapid correction and/or long boring consolidations along the way. Remember, if you are new, have a long term mindset.
My base case for this week is for the breakout to continue. Price targets will be in this week's Premium post.
MUCH MORE detailed price analysis, including short, medium and long-term forecasts on Market Protons!

Headlines
Bitcoin Miner Riot Platforms Buys $510 Million in BTC Following Private Offering
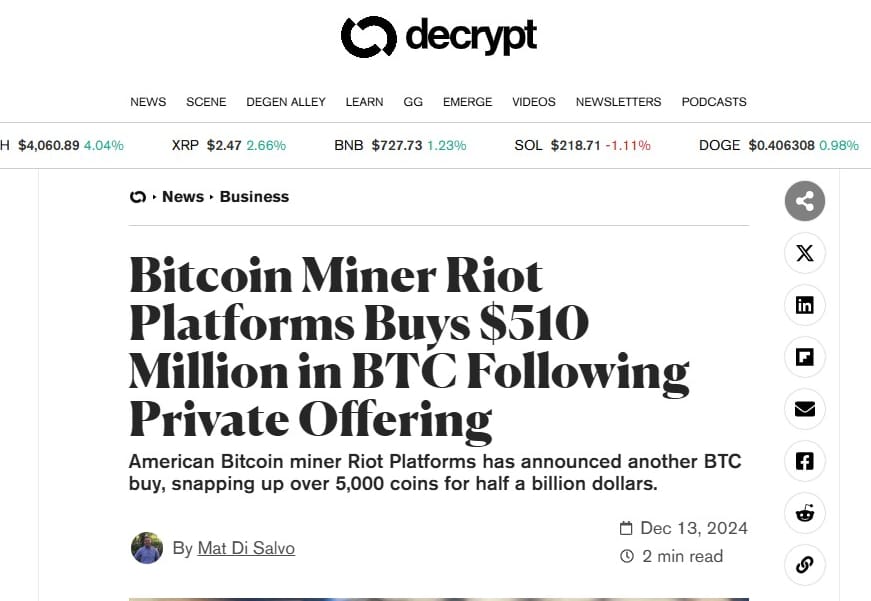
In its latest announcement Friday, the Castle Rock, Colorado-based Riot said it had snapped up 5,117 Bitcoin (BTC) at an average price of $99,669 per coin, including fees, ultimately spending $510 million in the process.
US Bitcoin Miners' Hashrate Share Up To 29% Despite Declining Market Cap, Says JP Morgan
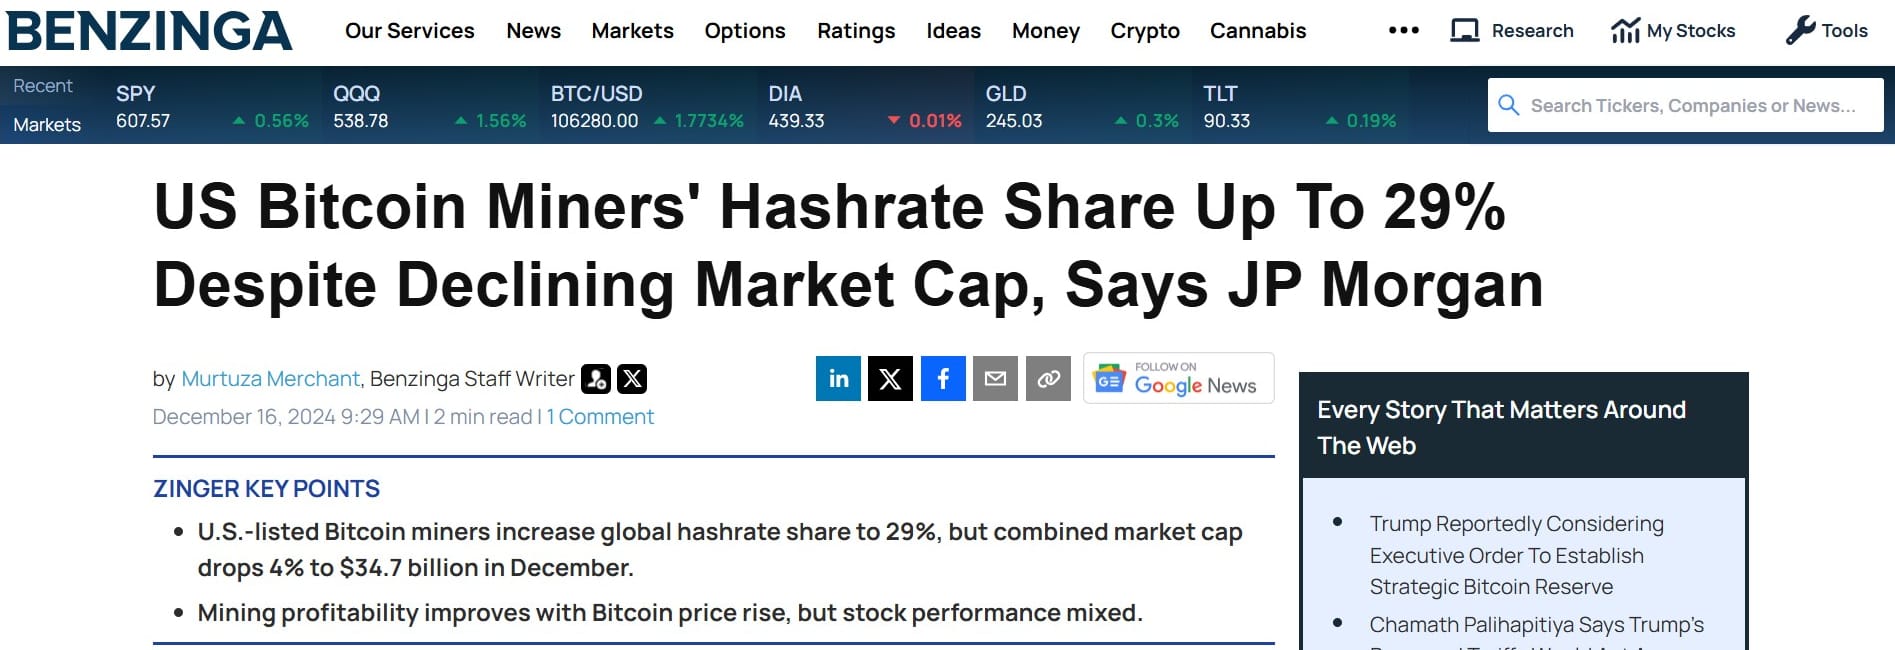
U.S.-listed Bitcoin miners have increased their share of the global network hashrate to approximately 29%, up by 7.8% since the Bitcoin halving earlier this year, according to a JP Morgan report.
Despite this notable growth in network power, the combined market cap of the 14 largest U.S.-listed mining companies declined 4% month-to-date, falling to $34.7 billion as of mid-December.
Hash rate and Difficulty
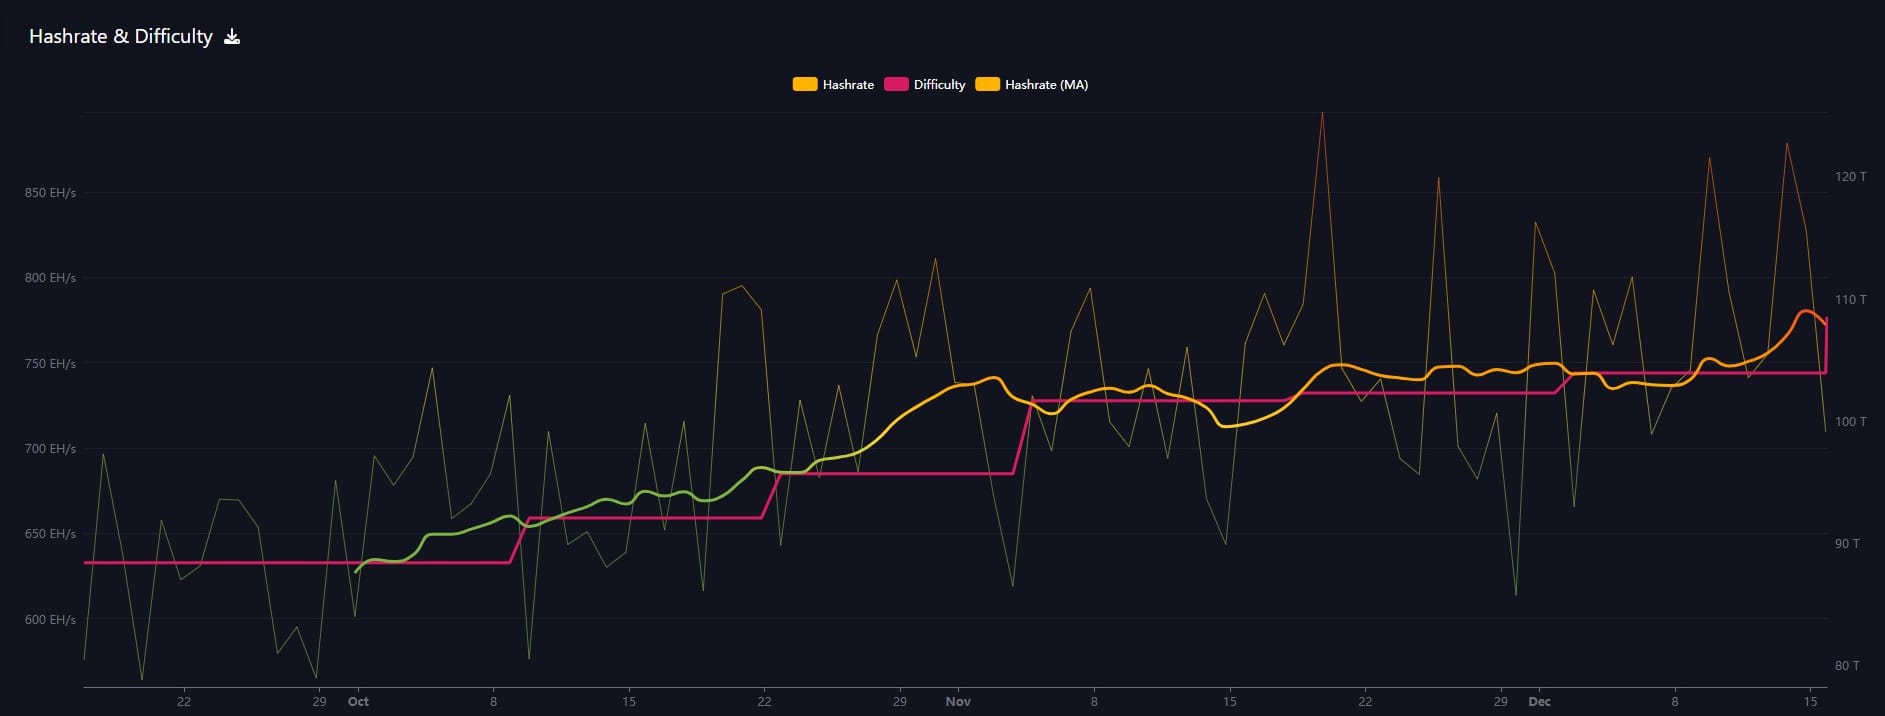
Hash rate has not spiked but maintained at the higher part of it's recent range over the last week, causing the network difficulty to jump 4.4% yesterday. This is a strong adjustment. I want to remind you that we have not seen a corresponding reaction from the miners to the recent price spike. That means that hash rate is underperforming price for the time being.
Mempool
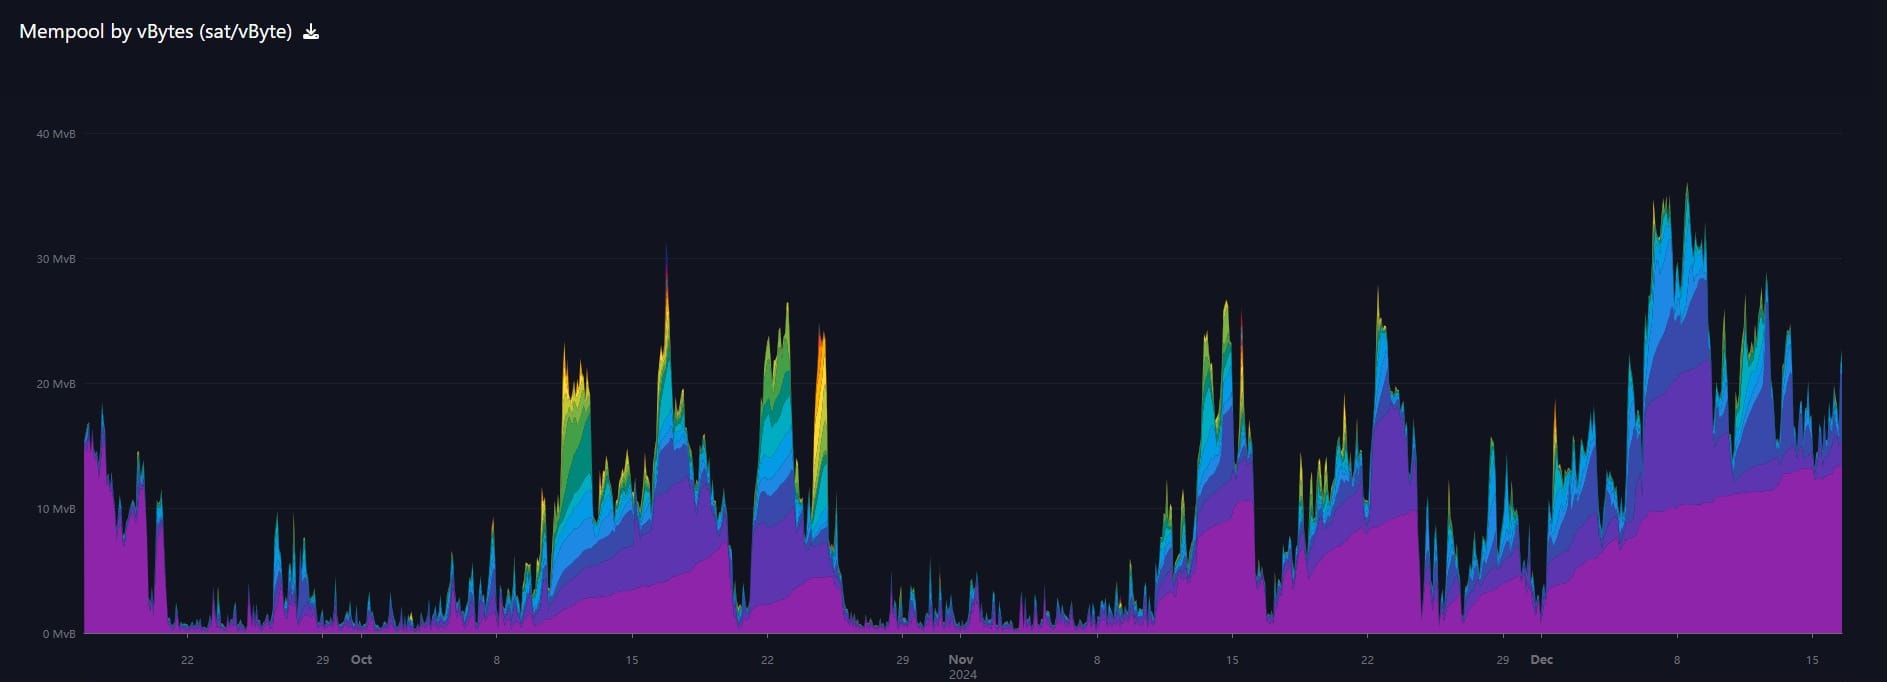
The mempool has not increased this week, but there are some transactions building up with slightly higher fees. In the first chart below, I've removed the 1-2 s/b transaction fees. You can see the next layer, 3-4 s/b fee (light purple) is rising.
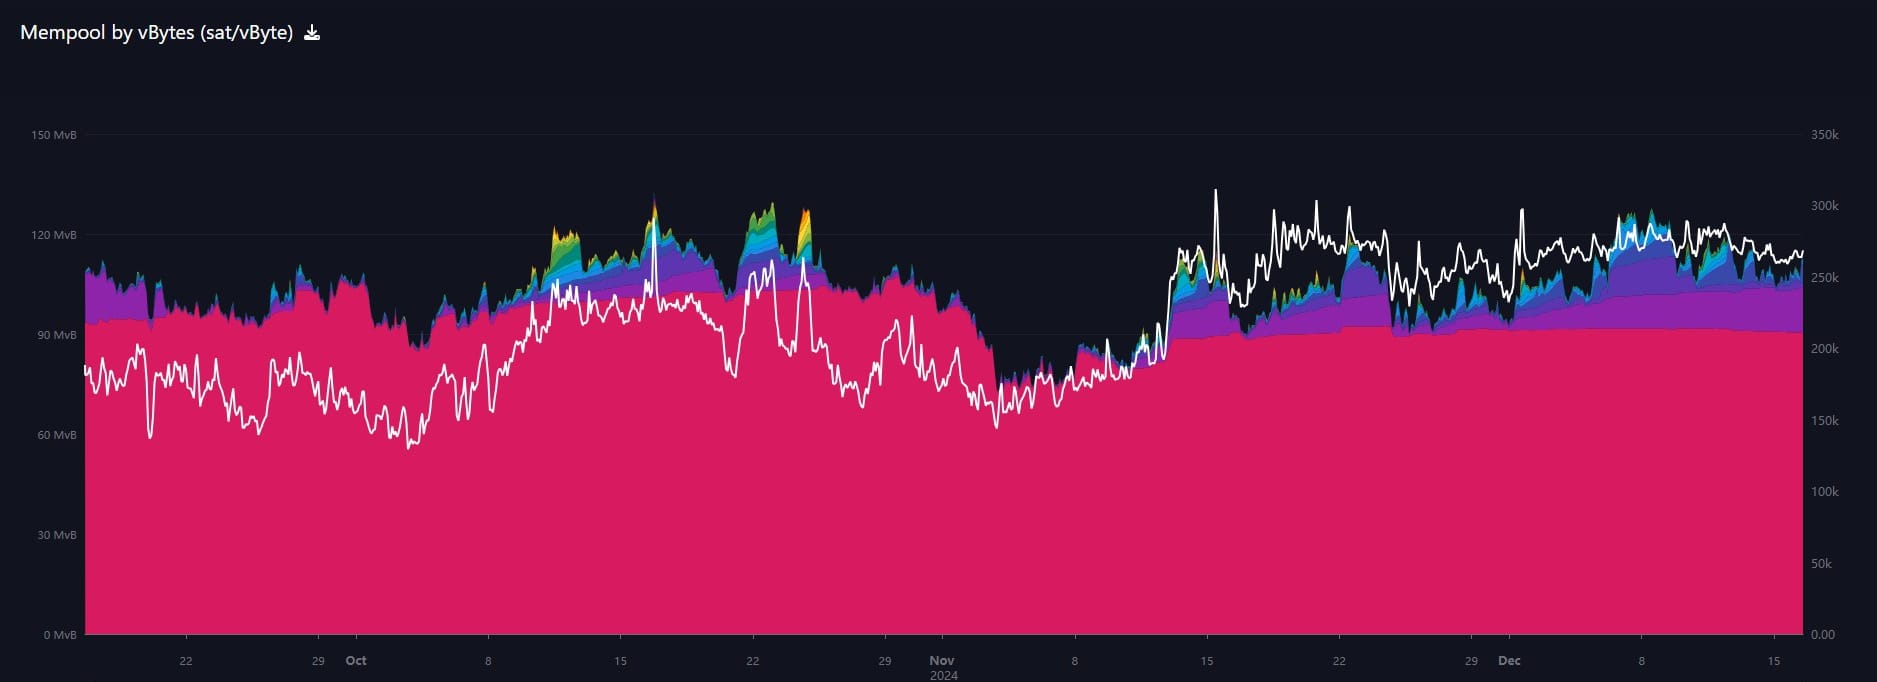
However, when we bring all the transactions back in, and add in the total transaction count (white line), we can see that the total number of transactions in the mempool is still relatively flat. This typically can be interpreted as a low risk of negative price action.

NSTR
In Case You Missed It...
My latest posts
- I have been releasing standalone videos for blog posts now. Please check them out and drop a comment!
- Endogenous Money and Bitcoin: A Shift in the Monetary Order
- Answering The Critics Of The Bitcoin Reserve Bill
- 10Y Yield and CPI Connection - Premium
- Google’s Quantum Computing Leap: What It Means For Bitcoin’s Security - FORBES
Hold Strong!
A
- Were you forwarded this newsletter? You can subscribe here.
- If you liked this newsletter please SHARE with others who might like it!
- Podcast links and socials on our Info Page.
- More ways to support our content, some don't cost a thing!
DONATE directly on Strike or Cash App to support my work! You make my content possible! Thank you.


Disclaimer: The content of Bitcoin & Markets shall not be construed as tax, legal or financial advice. Do you own research.
* Price change since last report
** According to mempool.space or 1ml.com


